


Edu News | May 14, 2024
Our Favorite Projects for Summertime STEAM

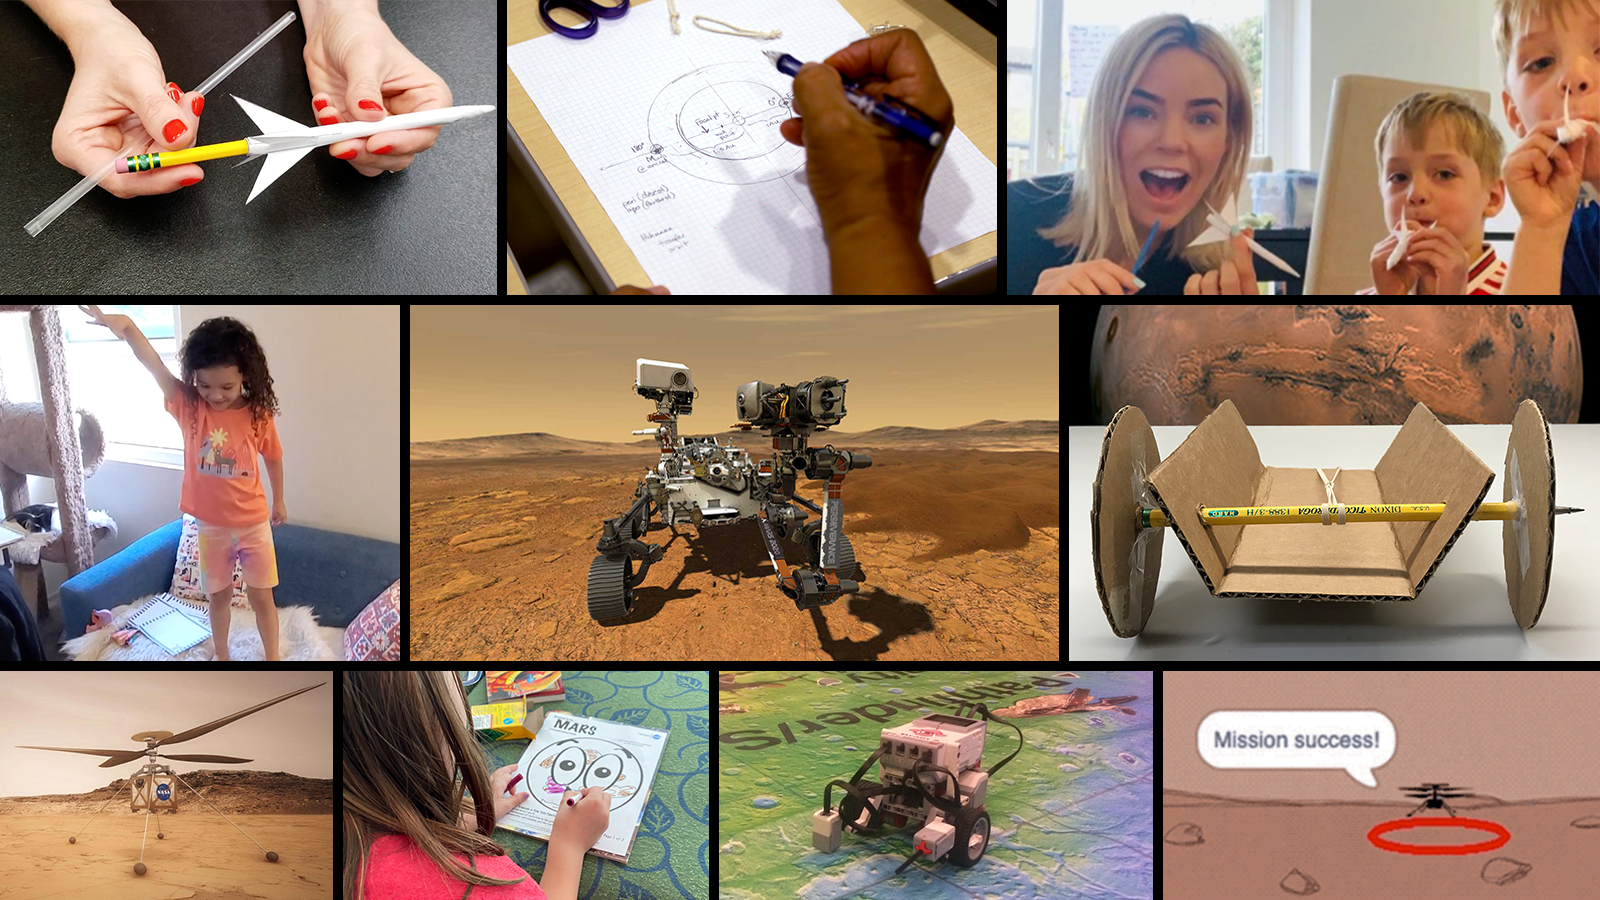
We're launching into summer by highlighting 15 of our favorite summertime projects for students, including a Mars student challenge you can do again and again.
Just because the school year is coming to a close doesn't mean student learning has to go on vacation. In fact, with our collections of more than 100 guided out-of-school time activities and student projects that are perfect for summertime, you can find a number of ideas for keeping kids engaged while they learn about STEAM and explore NASA missions and science in the process.
Here are 15 of our favorite summer-worthy activities, plus more ways to engage students in STEAM this summer.
-
 Project
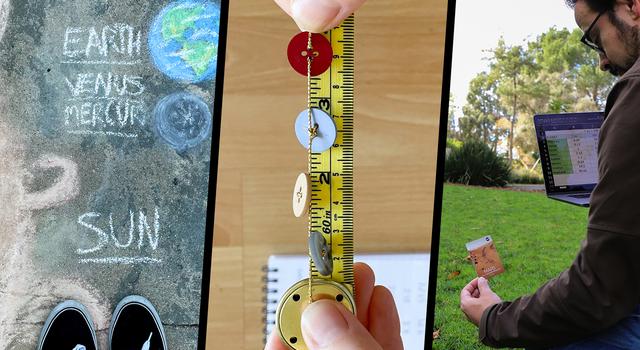
Make a Scale Solar System
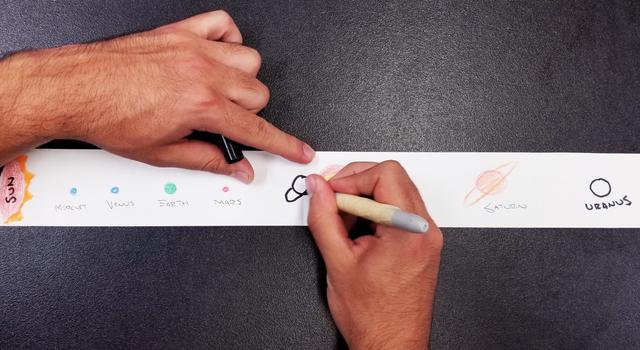
Use beads and string, sidewalk chalk, or your own creative choice of materials to build a scale model of planet sizes or distances in the solar system.
Subject Science
Grades 2-12
Time 30-60 mins
-
 Project
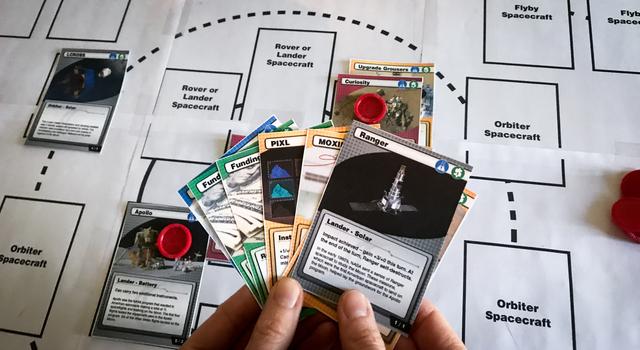
NASA Space Voyagers: The Game
In this strategy card game, you'll build spacecraft that can explore the Moon, Mars, and other destinations throughout our solar system while withstanding challenges thrown your way.
Subject Engineering
Grades 6-12
Time 1-2 hours
-
 Project
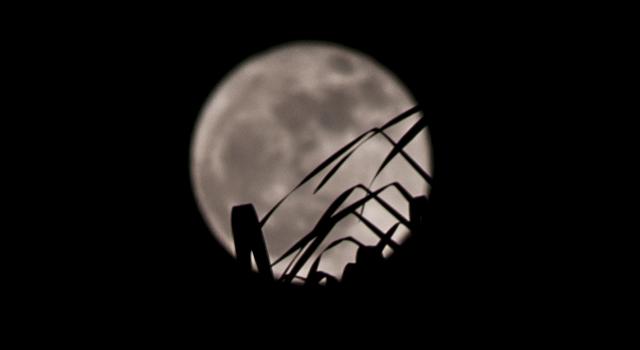
Look at the Moon! Journaling Project
Draw what you see in a Moon Journal and see if you can predict the moon phase that comes next.
Subject Science
Grades K-8
Time 1-2 mins/day for 30 days
-
 Project
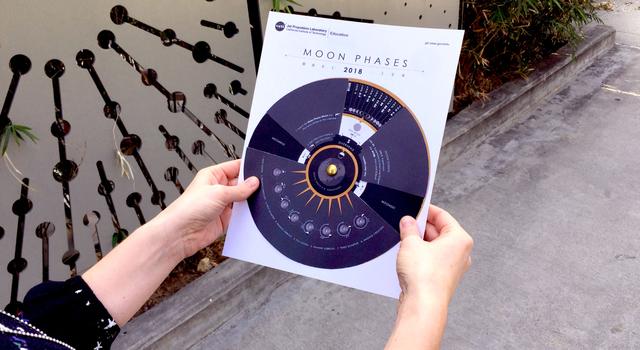
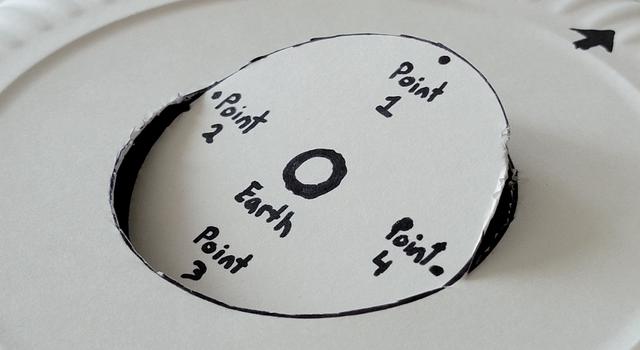
Make a Moon Phases Calendar and Calculator
Like a decoder wheel for the Moon, this calendar will show you where and when to see the Moon and every moon phase throughout the year.
Subject Science
Grades K-12
Time Less than 30 mins
-
 Project
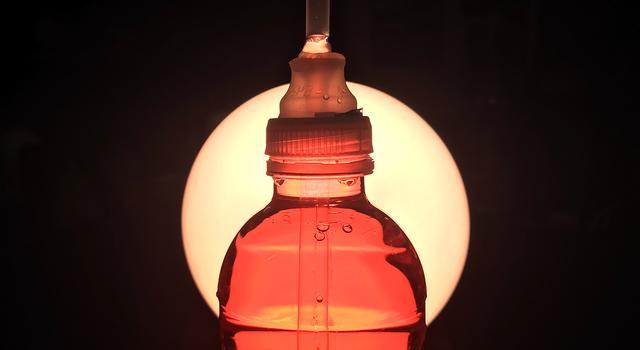
Make and Code a Light-Powered Device
In this challenge, you will build and program a light-powered device that can move to collect as much light as possible while not overheating.
Subject Technology
Grades 6-12
Time 2+ hours
-
 Project
Make a Paper Mars Helicopter
Build a paper helicopter, then see if you can improve the design like NASA engineers did when making the first helicopter for Mars.
Subject Engineering
Grades 2-8
Time 30-60 mins
-
 Project
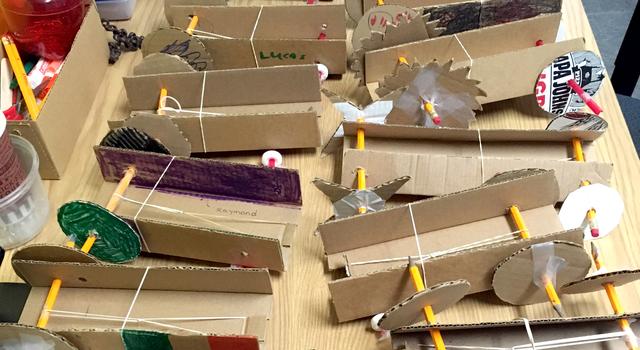
Make a Straw Rocket
Create a paper rocket that can be launched from a soda straw – then, modify the design to make the rocket fly farther!
Subject Engineering
Grades 4-8
Time Less than 30 mins
-
 Project
Make a Paper Glider
Turn a piece of paper into a glider inspired by a NASA design.
Subject Engineering
Grades 3-8
Time 30-60 mins
-
 Project
Space Origami: Make Your Own Starshade
Make your own model of this folding NASA space technology designed to help capture the first images of planets outside our solar system!
Subject Engineering
Grades 4-12
Time Less than 30 mins
-
 Project
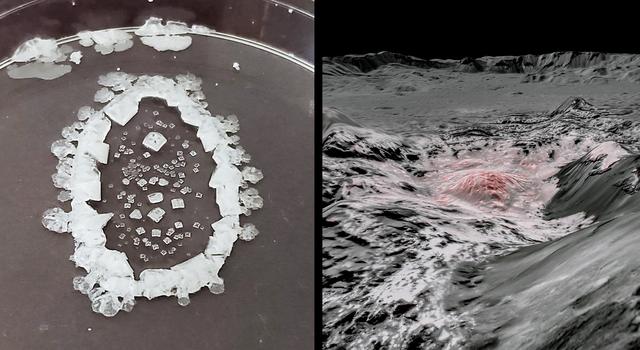
Do a Mineral Mystery Experiment
Dissolve salts in water, then observe what happens when the water evaporates. Now updated with findings from Mars!
Subject Science
Grades 2-12
Time Two sessions of 30-60 mins
-
 Project
Make a Moon Crater
Make craters like the ones you can see on the Moon using simple baking ingredients!
Subject Science
Grades 2-8
Time 30-60 mins
-
 Instructor Guide
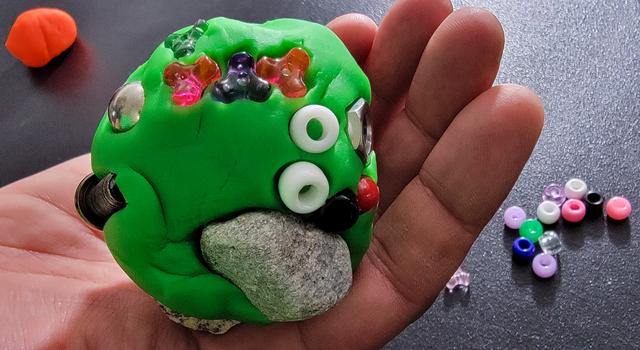
Design an Alien
Learners imagine and draw an alien that can survive with traits and environmental conditions that scientists look for in the search for life beyond Earth.
Subject Science
Grades 2-8
Time 30-60 mins
-
 Instructor Guide
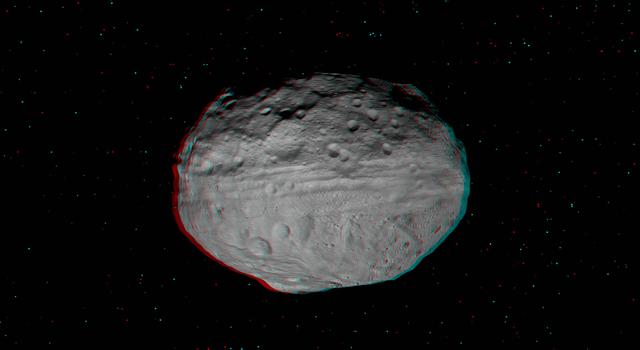
Modeling an Asteroid
Learners imagine and draw an alien that can survive with traits and environmental conditions that scientists look for in the search for life beyond Earth.
Subject Science
Grades 3-5
Time 30-60 mins
-
 Instructor Guide
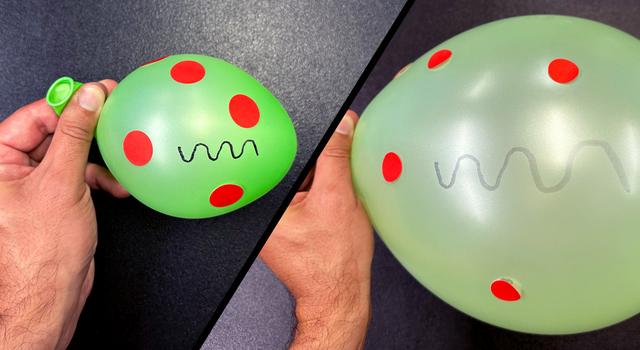
Model the Expanding Universe
Students learn about the role of dark energy and dark matter in the expansion of the universe, then make a model using balloons.
Subject Science
Grades 6-12
Time 30-60 mins
This last one is a great option for summer camps and other out-of-school time groups looking to fill their summer programming with STEAM. Explore seven weeks worth of lessons and activities that can be customized to your group's needs and get kids planning and designing their own mission to Mars!
Explore More
Explore the full collections of guided activities and projects at the links below:-
 Collection
Out-of-School Time STEAM
Explore a collection of guided STEAM activities for out-of-school time groups.
-
 Collection
Summertime Projects for Students
Build paper rockets and gliders, make a moon journal, write space poetry and more. These projects are the perfect way to launch into summer.
TAGS: K-12 Education, Out-of-School Time, Afterschool, Informal Education, Summer, Resources, Projects, Students, STEAM


Meet JPL Interns | May 6, 2024
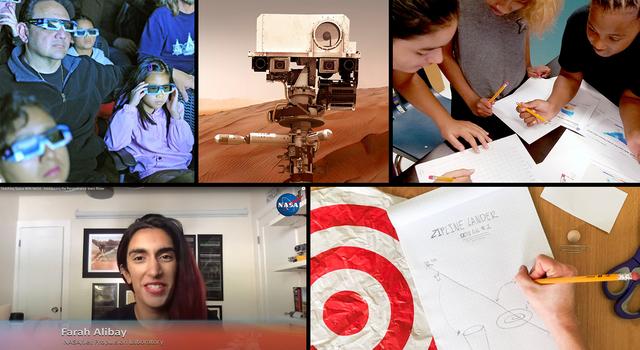
Meet the JPL Interns Preparing a Team of Rovers for the Moon

For these six students, an internship at NASA's Jet Propulsion Laboratory meant playing a key hands-on role in developing a trio of small rovers destined for the Moon and designed to show the promise of multirobot missions.
Watch their story in the video below, and explore related links.
Explore More
-
 Opportunities
JPL Internships and Fellowships
Discover exciting internships and research opportunities at the leading center for robotic exploration of the solar system.
-
 Article
How to Get an Internship at JPL
Here's everything you need to know about the world of JPL internships, the skills that will help you stand out, and how to get on the right trajectory even before college.
-
 Articles
Meet JPL Interns
Hear stories from interns pushing the boundaries of space exploration and science at the leading center for robotic exploration of the solar system.
-
 Math Problem
Moon Mappers: A ‘Pi in the Sky’ Math Challenge
In this illustrated math problem, students use the mathematical constant pi to determine how far a team of rovers drive on the Moon.
Subject Math
Grades 9-12
Time Less than 30 mins
TAGS: Internships, Higher Education, CADRE, Moon, Rovers, Engineering

Teachable Moments | April 22, 2024
Tracking Tiny Movements Means Big Impacts for Earth Science

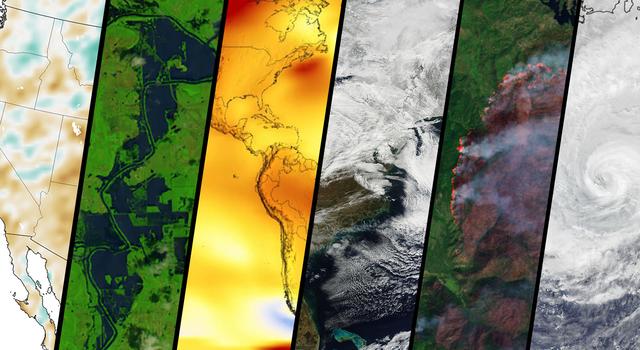
Find out how the upcoming NISAR mission, an Earth satellite designed to capture detailed views of our planet's changing surface, will provide new insights into everything from natural disasters to climate change. Plus, connect it all to STEM learning.
The next addition to NASA’s fleet of Earth Science orbiters is launching in 2024 and will represent a monumental leap forward in how we monitor our changing planet. The NISAR mission is a collaboration between NASA and the Indian Space Research Organisation that’s designed to monitor and study tiny movements of Earth’s surface from events like natural disasters and climate change.
Read on to find out how NISAR is pushing the boundaries of Earth science from space. Plus, learn how you can bring science and engineering from the mission to your students.
How NISAR Works
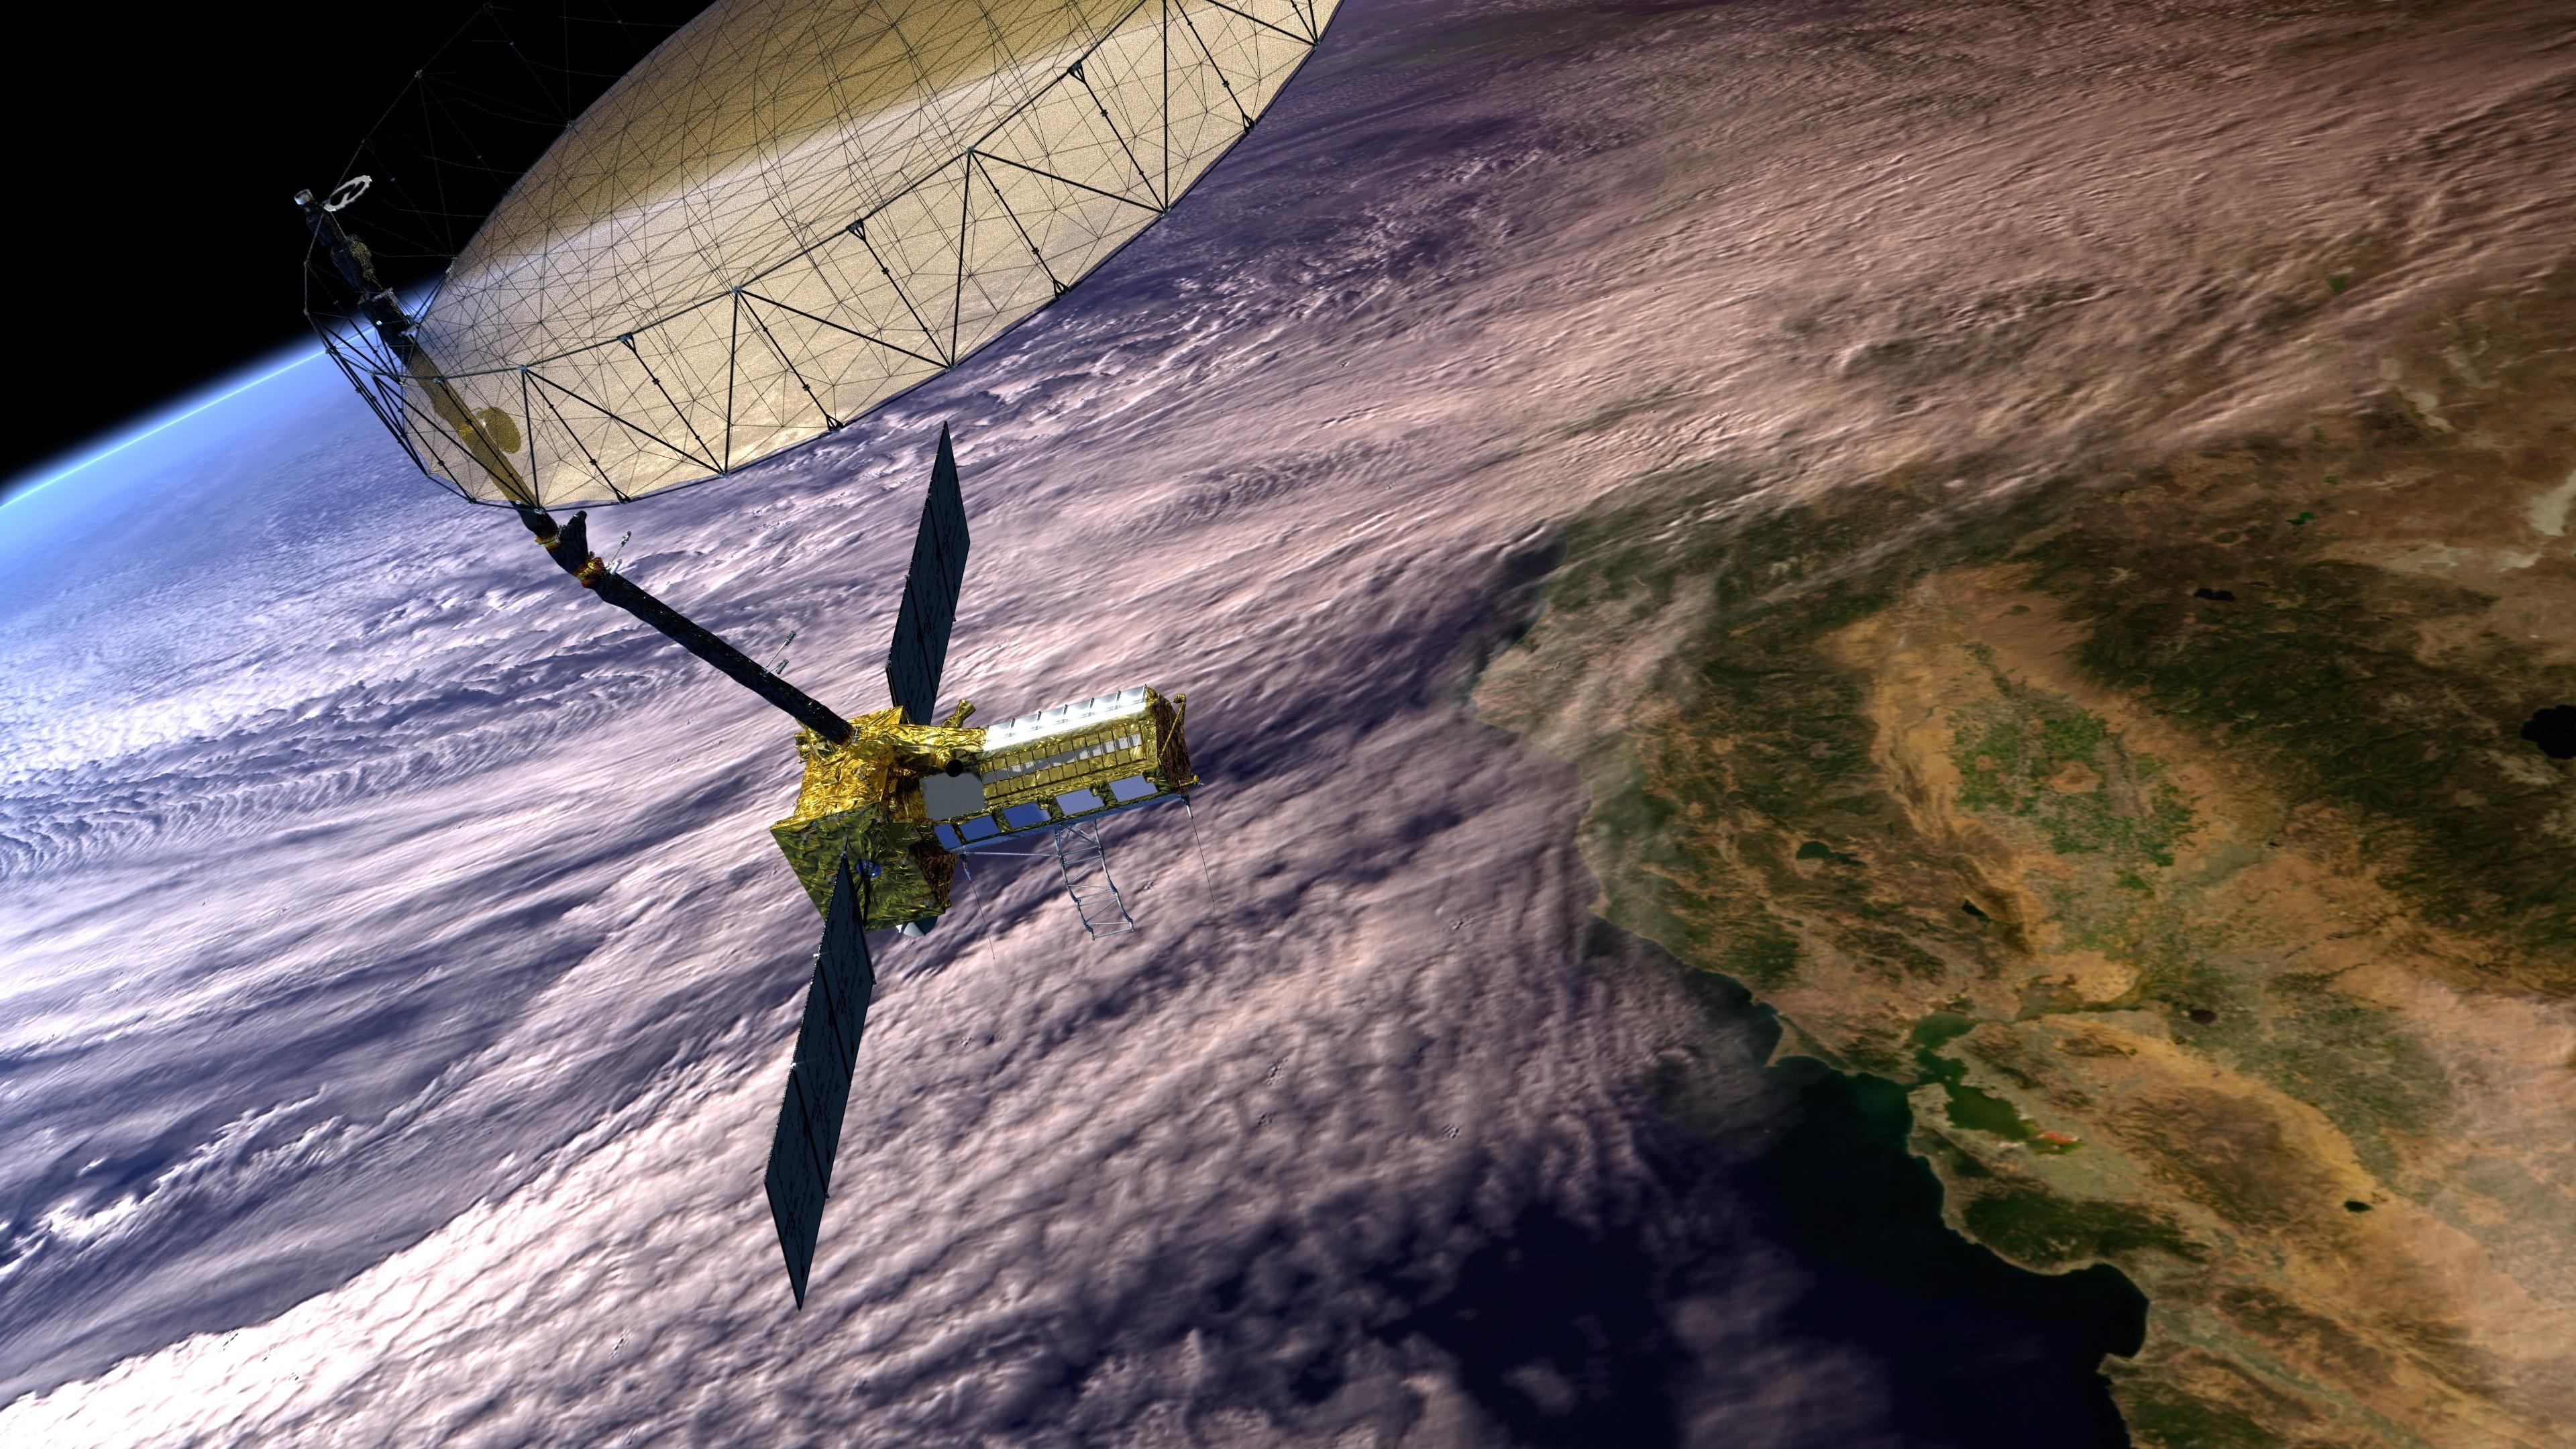
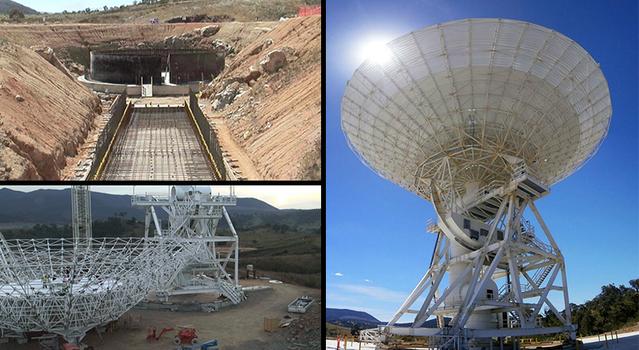
NISAR is among the most advanced radar systems on an Earth science mission to date due to its supersized antenna reflector, use of synthetic aperture radar, and ability to observe Earth in two different radar frequencies simultaneously.
Hear mission experts describe how the NISAR satellite will track our changing Earth in fine detail. Credit: NASA/JPL-Caltech
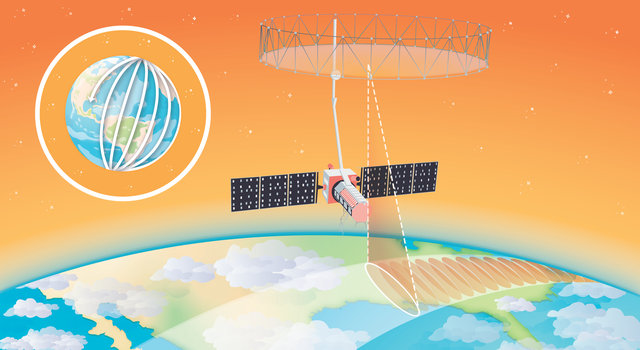
Extending above the spacecraft like a giant catcher's mitt, NISAR’s antenna reflector is 39 feet (12 meters) wide – the largest ever launched as part of a NASA Earth-observing mission. This antenna creates an observational window, or swath, of the surface beneath the spacecraft that is 150 miles (242 kilometers) wide. The swath size is determined by the radar wavelength and antenna size, which is important because there is a direct relationship between antenna size and the resolution of images and data that can be captured by NISAR.
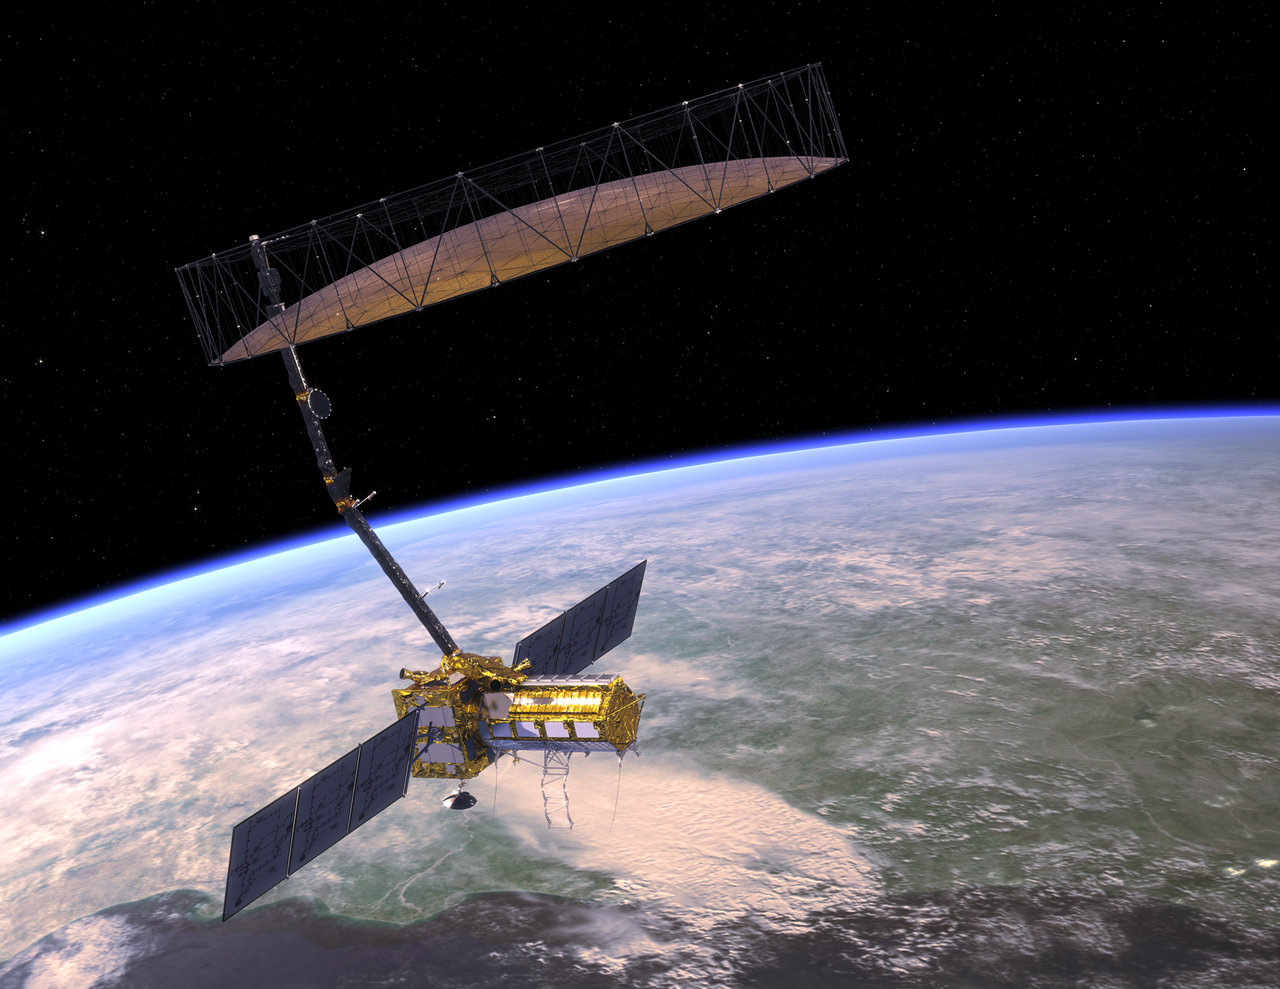
NISAR's antenna reflector extends above the spacecraft like a catcher's mitt and is engineered to help the mission get an unprecedented view of Earth's surface. Credit: NASA/JPL-Caltech | + Expand image
We typically want the best resolution possible, but we’re limited by the size of the antenna we can build and deploy in space. Conventionally, the resolution on a satellite is a function of the wavelength it uses and the size of the antenna. The larger the wavelength, the bigger the antenna needs to be to get quality images. At typical radar wavelengths, with a 12 meter diameter reflector, the best achievable resolution would be as coarse as 10s of kilometers, which is not very useful for observing features on Earth at the human scale.
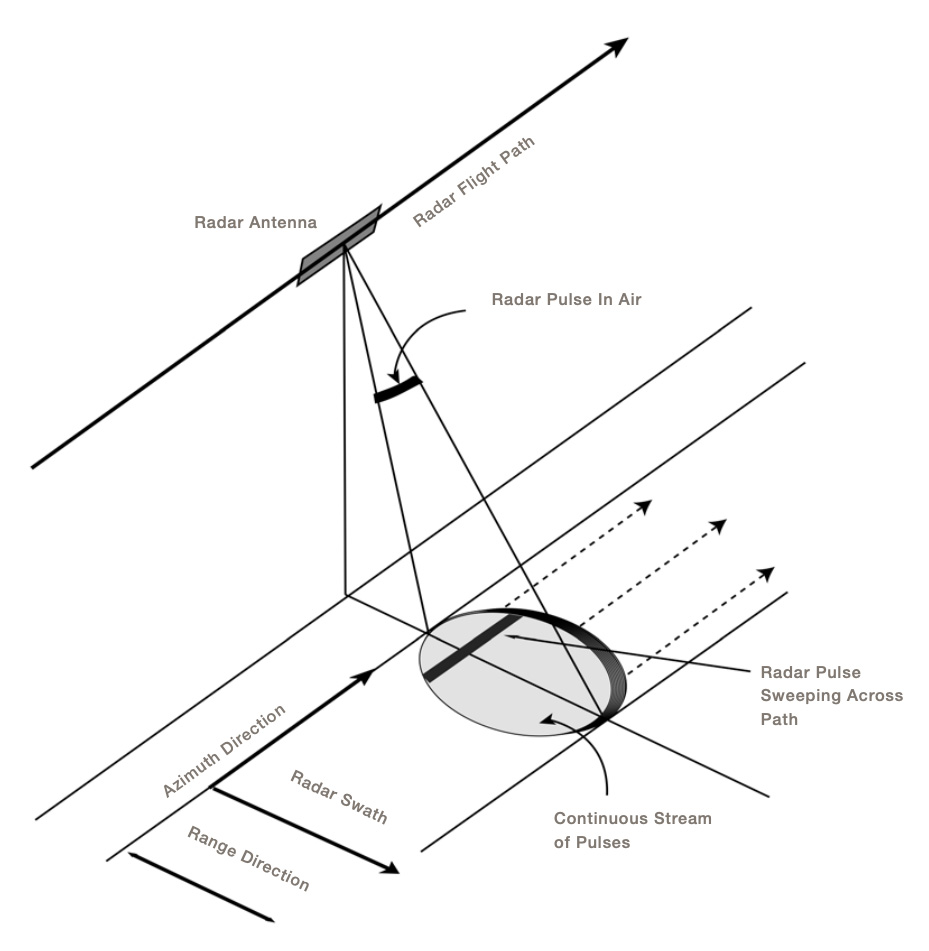
This diagram shows how synthetic aperature radar works by sending multiple radar pulses to an area on the ground from an antenna passing overhead. Credit: NASA | + Expand image
This is why NISAR utilizes an approach called synthetic aperture radar, or SAR, to synthetically magnify the resolution achievable from the antenna. With SAR, the spacecraft sends multiple signals, or pulses, to an area as it flies overhead. Each signal gets reflected back to the spacecraft, which is meticulously designed to “catch” the reflected signals thanks to its position and velocity. Each signal in the sequence is then focused into a single high-resolution image, creating an effect as if the spacecraft is using a much larger antenna.
Radar uses radio wavelengths, which are longer than those of visible light, allowing us to see through clouds and sometimes even tree coverage to the ground below, depending on the frequency of the radio waves. We’re also able to interpret a lot of information about the surface from the way the signal returns back to the orbiter. This is because NISAR will measure the amount of scatter, or dispersion, of the signal as compared to when it was originally transmitted.
For example, a rigid, sharp angled building will bounce the signal back to the receiver differently than a leafy tree. Different radio frequencies are better used for different surfaces because they are influenced by the type of surface being analyzed. To this end, NISAR is the first mission to use two different radar frequencies simultaneously. The L-Band can be used to monitor heavier vegetation and landscapes while the S-Band is better tuned for lighter vegetation and crop growth. The two wavelengths in general extend the range of sensitivity of the measurement to smaller and larger changes.
This combination of tools and features will allow NISAR to construct global maps of changes in the position of any given pixel at a scale of just centimeters as well as subtle changes in reflectivity due to land cover changes on all land and ice surfaces twice every 12 days. The resolution combined with repetition will allow scientists to monitor the changes taking place on our planet in a matter of days more comprehensively than ever before.
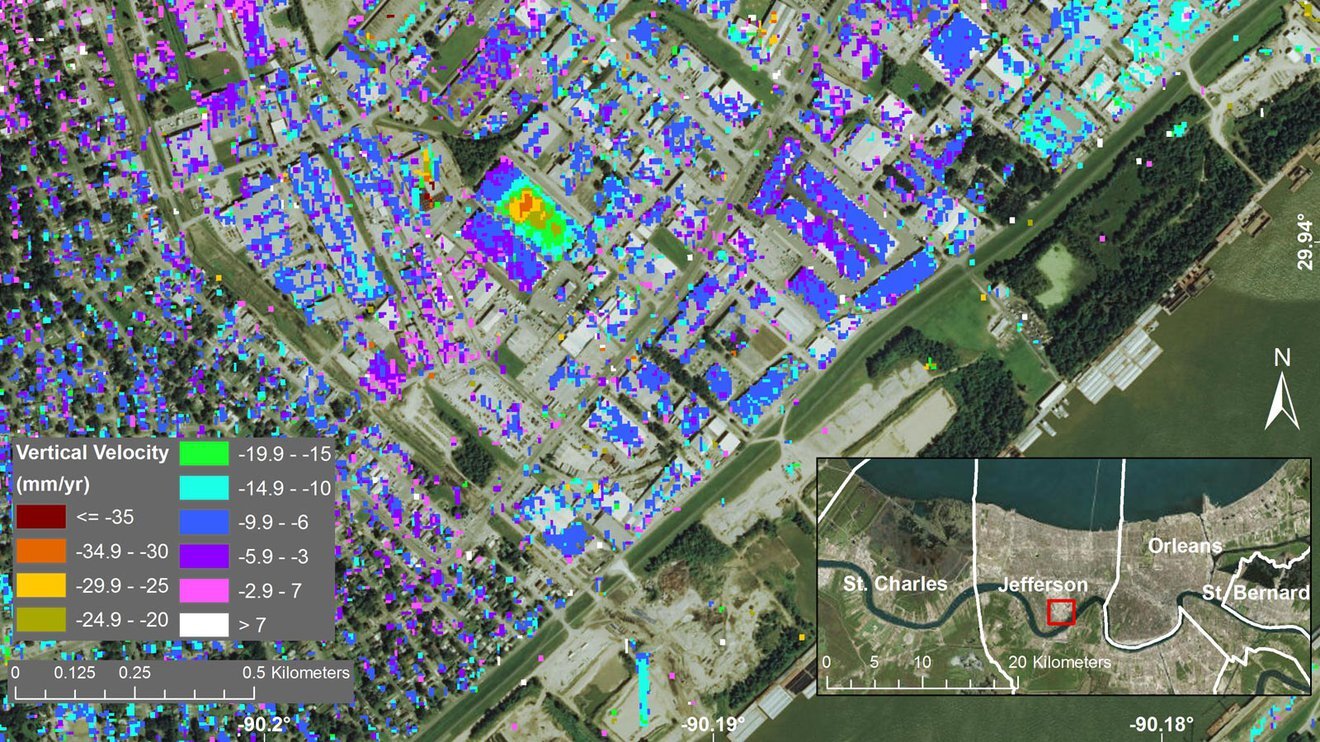
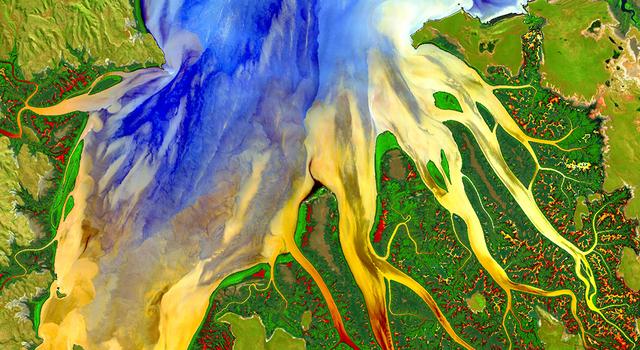
This satellite image of New Orleans is overlaid with synthetic aperature radar data from the UAVSAR instrument to show the rate at which the land was sinking in a section of New Orleans from June 2009 to July 2012. Credit: NASA/JPL-Caltech, Esri | › Learn more
What the NISAR Mission Will Show Us
Because of the massive amount of data produced by NISAR, we’ll be able to closely monitor the impacts of environmental events including earthquakes, landslides, and ice-sheet collapses. Data from NISAR could even be used to assess the risk of natural hazards.
Scientists can use NISAR to monitor tiny movements in Earth’s surface in areas prone to volcanic eruptions or landslides. These measurements are constructed using what’s called an interferogram, which looks at how the maps generated for each pass of the spacecraft have changed over time. For example, we could see immediate changes to the topography after an earthquake with an interferogram made from images NISAR collected shortly before and soon after the event.
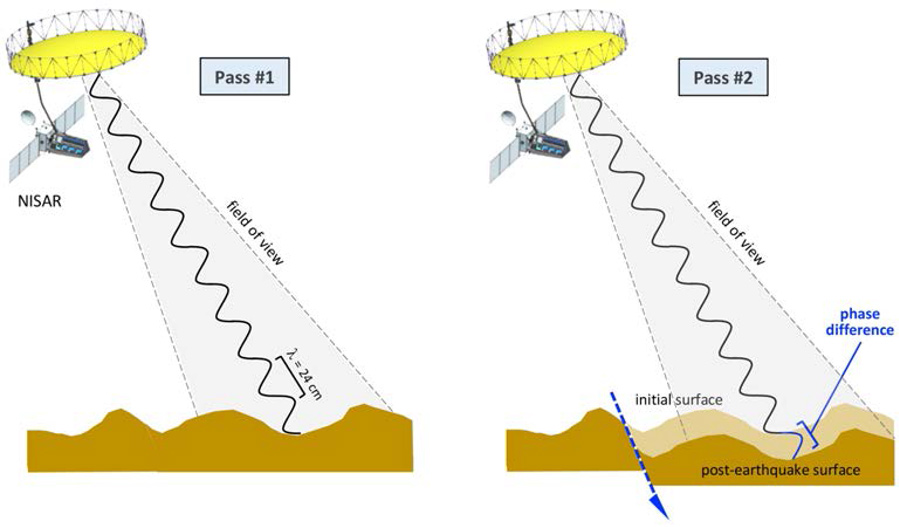
Using interferometry, as shown in this diagram, NISAR can capture changes or deformation in land surfaces, such as after an earthquake. | + Expand image
By tracking and recording these events and other movements on the surface leading up to natural disasters, it may be possible to identify warning signs that can improve detection and disaster response.
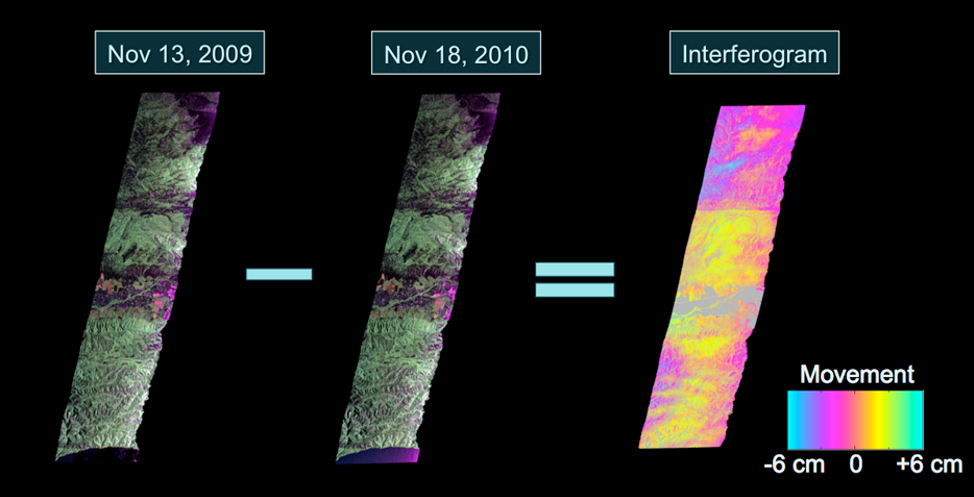
The first two images in this series were captured by the UAVSAR instrument during two separate passes over California's San Andreas Fault about a year apart. The two images were then combined to create the third image, which an interferogram that shows how the surface changed between the two passes of the instrument. Credit: NASA/JPL-Caltech | + Expand image
And NISAR isn’t just limited to studying the solid Earth. As missions prior have done, it will also be able to generate maps of polar ice sheets over time and detect changes in permafrost based on the regional movement of the soil below. These measurements will give climate scientists a clear picture of how much the ice is moving and deforming due to climate change and where it is thawing as the ground warms.
Additionally, NISAR can track land usage, deforestation, sea levels, and crustal deformation, informing scientists about the impacts of environmental and climate change on Earth.
Follow Along With NISAR
NISAR is scheduled to launch in 2024 from the Satish Dhawan Space Centre in Sriharikota, India, and will enter a polar orbit 460 miles (747 kilometers) above Earth. For the first 90 days after launch, the spacecraft will undergo checks and commissioning before beginning scientific observations for a primary mission designed to last three years.
Science from the mission will be downlinked to both NASA and ISRO ground stations below with data and the tools to process it freely available for download and use to all professional and citizen scientists.
Visit NASA’s NISAR mission page for the latest updates about the mission.
Teach Earth Science With NISAR
With the launch of NISAR, we will be better able to monitor and mitigate natural disasters and understand the effects of climate change. Bring the fleet of NASA Earth Science missions to your classroom with the following lessons and activities:
Lessons
-
 Math Problem
Orbit Observation: A ‘Pi in the Sky’ Math Challenge
In this illustrated math problem, students use the mathematical constant pi to figure out how much data the NISAR spacecraft collects every day.
Subject Math
Grades 7-12
Time Less than 30 mins
-
 Lesson
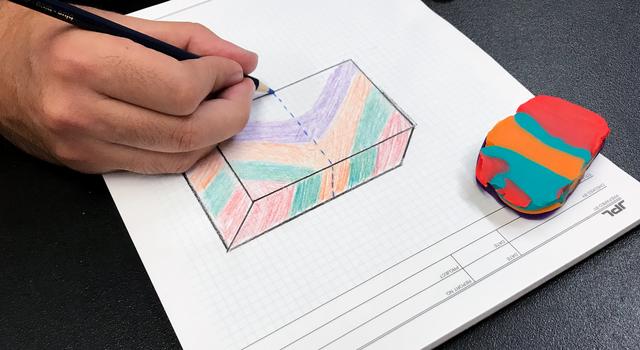
Modeling Crustal Folds
Students use playdough to model how Earth’s crust is bent and folded by tectonic plates over geologic time.
Subject Science
Grades 6-12
Time 30-60 mins
-
 Lesson
Making Topographic Maps
Students draw and interpret topographic maps while learning about technology used to map Earth's surface, the seafloor, and other worlds.
Subject Science
Grades 6-12
Time 1-2 hrs
-
 Lesson
Using Light to Study Planets
Students build a spectrometer using basic materials as a model for how NASA uses spectroscopy to determine the nature of elements found on Earth and other planets.
Subject Science
Grades 6-11
Time 2+ hrs
-
 Lesson
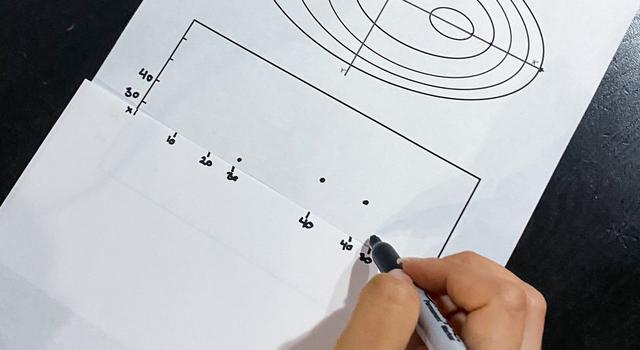
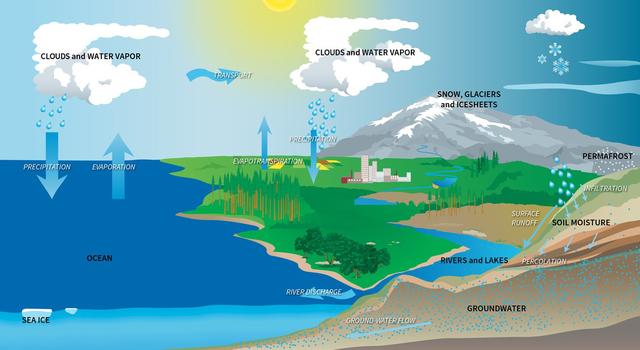
Modeling the Water Budget
Students use a spreadsheet model to understand droughts and the movement of water in the water cycle.
Subject Science
Grades 5-8
Time 30-60 mins
-
 Lesson
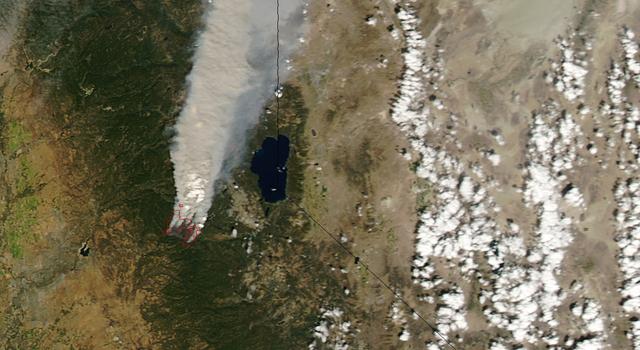
Fired Up Over Math: Studying Wildfires from Space
Students learn how scientists assess wildfires using remote sensing and solve related math problems, appropriate for various grade levels.
Subject Math
Grades 3-12
Time 30-60 mins
-
 Lesson
Earth Science Data Visualizations – How to Read a Heat Map
Students learn to read, interpret and compare “heat map” representations of Earth science data.
Subject Science
Grades 4-12
Time 30-60 mins
-
 Lesson
Lessons in Sea-Level Rise
What is sea-level rise and how does it affect us?
Subject Science
Grades 5-12
Time 30-60 mins
-
 Collection
Earth Science Lesson Collection
Discover a collection of standards-aligned STEM lessons all about Earth and climate change.
-
 Collection
Climate Change Lesson Collection
Explore a collection of standards-aligned STEM lessons for students that get them investigating climate change along with NASA.
Student Projects and Activities
- Collection
Exploring Earth Activities Collection
Try these science and engineering projects, watch videos, and explore images all about the planet that we call home.
-
 Collection
Climate Change Activities Collection
Learn about climate change and its impacts with these projects, videos, and slideshows for students.
Articles
-
 Collection
Teachable Moments in Climate Change
Explore this collection of Teachable Moments articles to get a primer on the latest NASA Earth science missions, plus find related education resources you can deploy right away!
-
 Collection
Earth Minute Video Series
This series of animated white-board videos for students of all ages explains key concepts about Earth science, missions, and climate change.
-
 Expert Talk
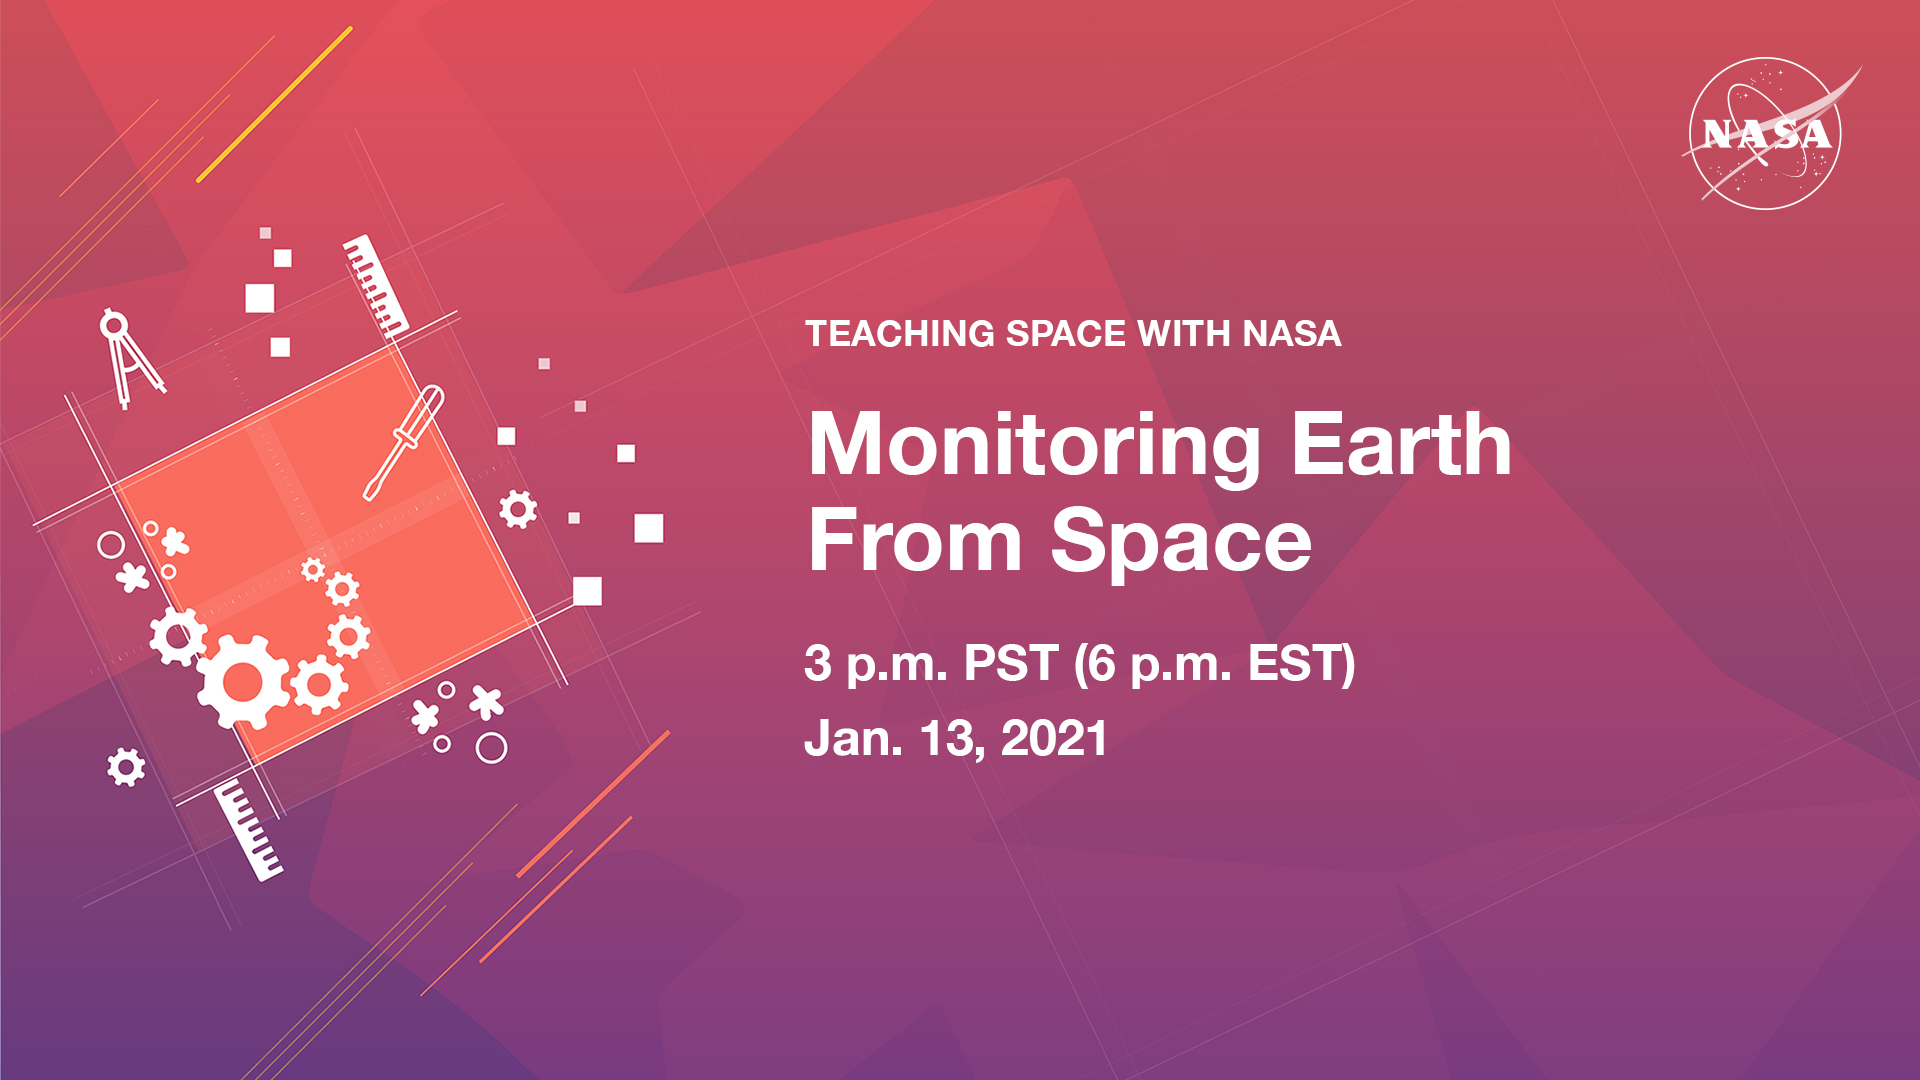
Monitoring Earth from Space
In this educational talk, NASA experts discuss how we build spacecraft to study climate, then answer audience questions.
- Interactive: NASA Eyes on Earth
- Images: NASA Earth Observatory
- Gallery: Images of Climate Change
- Infographic: Sea Level Rise
Videos
Explore More
Websites
Facts & Figures
Multimedia
TAGS: K-12 Education, Resources, Earth Science, Climate Change, NISAR

Teachable Moments | March 18, 2024
The Science of Solar Eclipses and How to Watch With NASA

Get ready for the April 8 total solar eclipse. Learn about the science behind solar eclipses, how to watch safely, and how to engage students in NASA science.
On April 8, 2024, a total solar eclipse will be visible across much of the central and northeastern United States, as well as parts of Mexico and Canada.
Whether you are traveling to the path of the total eclipse or will be able to step outside and watch the eclipse where you live, here's everything you need to know, including what to expect, how to watch safely, and how to engage in scientific observations and discovery with NASA.
What Are Solar Eclipses?
Solar eclipses occur when the Sun, the Moon, and Earth align. For this alignment to happen, two things need to be true. First, the Moon needs to be in the new moon phase, which is when the Moon’s orbit brings it between Earth and the Sun. Second, eclipses can only happen during eclipse seasons, which last about 34 days and occur just shy of every six months. An eclipse season is the time period when the Sun, the Moon, and Earth can line up on the same plane as Earth's orbit during a new or full moon. If a new moon happens during an eclipse season, the shadow cast by the Moon will land on Earth, resulting in a solar eclipse. Most of the time, because the Moon’s orbit is slightly tilted, the Moon’s shadow falls above or below Earth, and we don't get a solar eclipse.
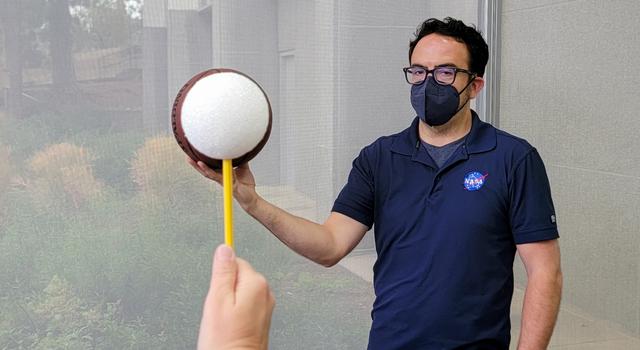
Not all solar eclipses look the same. The distance between the Sun, the Moon, and Earth plays an important role in what we see during a solar eclipse. Even though the Moon is much smaller than the Sun (about 400 times smaller in diameter), the Sun and Moon look about the same size from Earth. This is because the Sun is about 400 times farther away than the Moon. But as the Moon travels its elliptical orbit around Earth, its size appears slightly larger when it is closer to Earth and slightly smaller when it is farther from Earth. This contributes to the different kinds of solar eclipses you might have heard about. For example:
- During a total solar eclipse, the Moon is closer to Earth in its orbit and appears larger, completely blocking the Sun's disk. This allows viewers in the path of totality to see the Sun’s corona, which is usually obscured by the bright light of the Sun’s surface.
- An annular solar eclipse occurs when the Sun, Moon, and Earth are properly aligned, but the Moon is farther away in its orbit, so it does not completely cover the Sun's disk from our perspective. Annular eclipses are notable for the "ring of fire," a thin ring of the Sun’s disk that's still visible around the Moon during annularity. The name annular eclipse comes from the world of mathematics, where a ring shape is known as an annulus.
- Partial eclipses can happen for two reasons. First, viewers outside the path of totality during a total solar eclipse – or the path of annularity during an annular eclipse – will see only part of the Sun’s surface covered by the Moon. The other time a partial eclipse can occur is when the Moon is nearly above or below Earth in its orbit so only part of the Moon’s shadow falls on Earth. In this case, only part of the Sun’s surface will appear covered by the Moon.
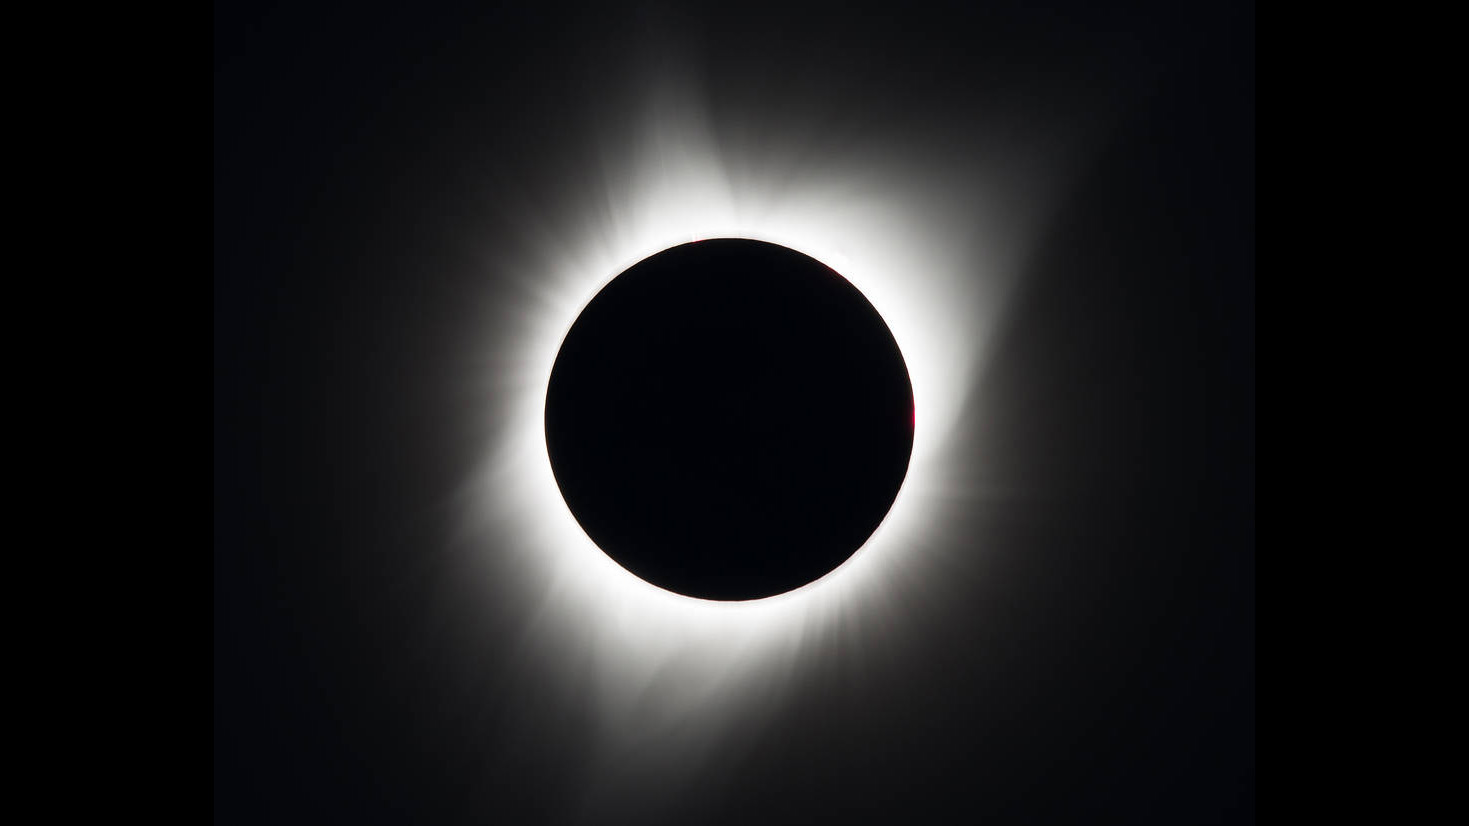
This image of a total solar eclipse was captured on Aug. 21, 2017 from Madras, Oregon. Image credit: NASA/Aubrey Gemignani | › Full image and caption
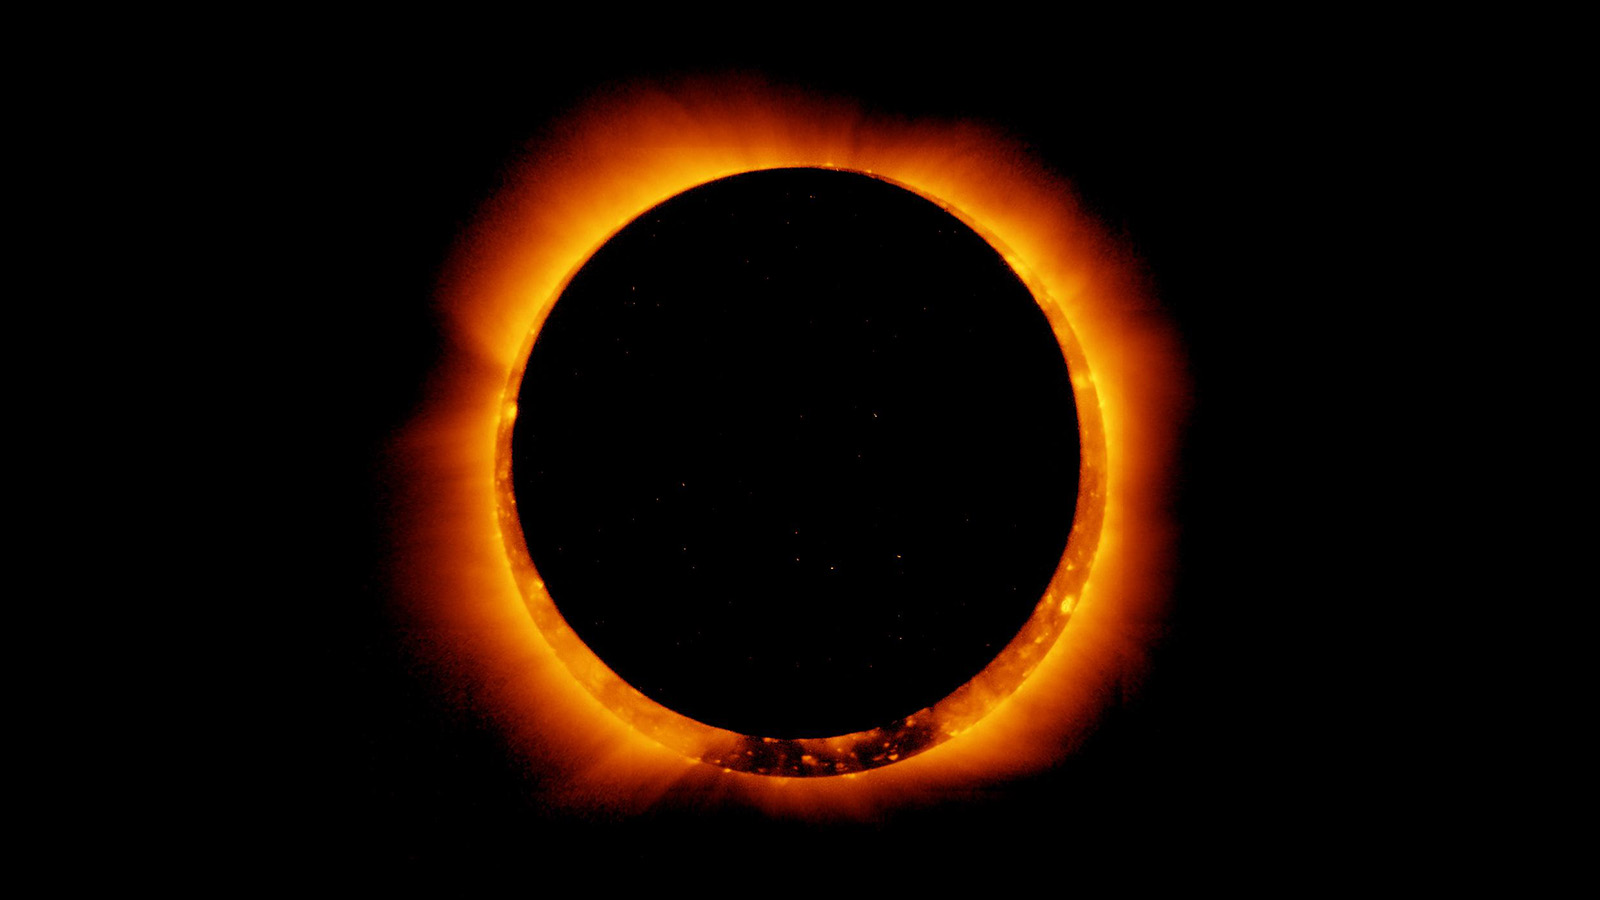
On Jan. 4, 2017, the Hinode satellite captured these breathtaking images of an annular solar eclipse. Image credit: Hinode/XRT | › Full image and caption
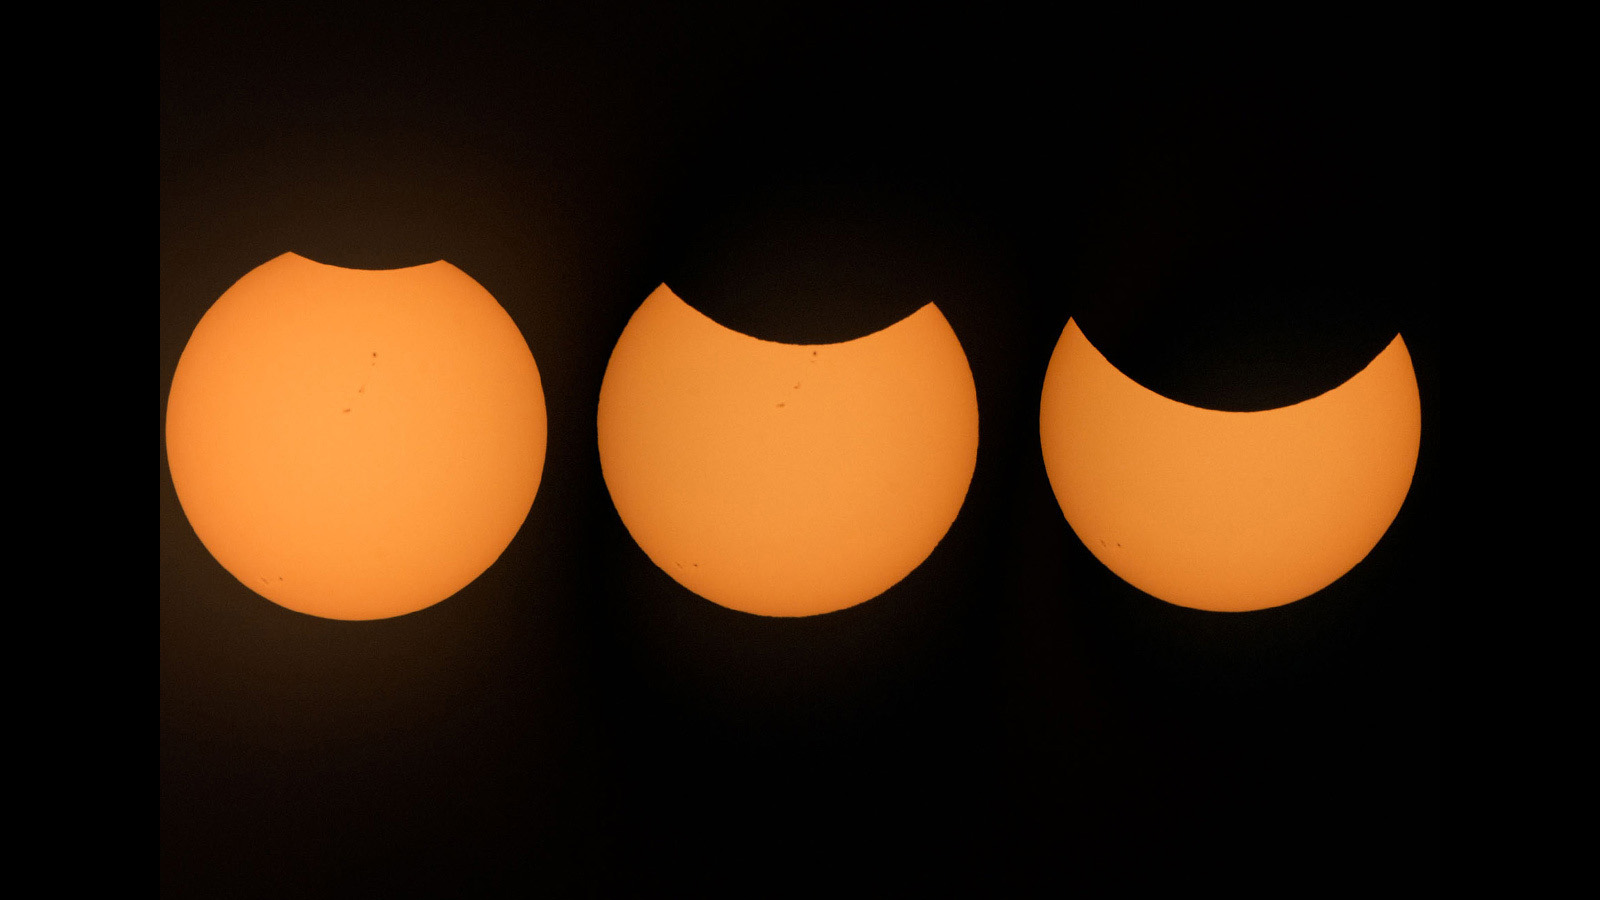
The Sun appears partially eclipsed in this series of photos taken from NASA’s Johnson Space Center in Houston on Aug. 21, 2017. Image credit: NASA/Noah Moran | › Full image and caption
How to Watch the Upcoming Solar Eclipse
First, an important safety note: Do not look directly at the Sun or view any part of the partial solar eclipse without certified eclipse glasses or a solar filter. Read more below about when you can safely view the total solar eclipse without eclipse glasses or a solar filter. Visit the NASA Eclipse website for more information on safe eclipse viewing.
When following proper safety guidelines, witnessing an eclipse is an unparalleled experience. Many “eclipse chasers” have been known to travel the world to see solar eclipses. Here's what to expect on April 8, 2024:
The start time and visibility of the eclipse will depend on your location. You can use the interactive map below to find detailed eclipse information, including timing and coverage, by entering in your location. A list of some of the cities and start times along the path of totality is available on the NASA Science website.
Explore when and where to view the eclipse with this interactive map from NASA. Enter your zip code to see what will be visible in your viewing location and when to watch. Credit: NASA's Scientific Visualization Studio
The eclipse begins when the edge of the Moon first crosses in front of the disk of the Sun. This is called a partial eclipse and might look as if a bite has been taken out of the Sun.
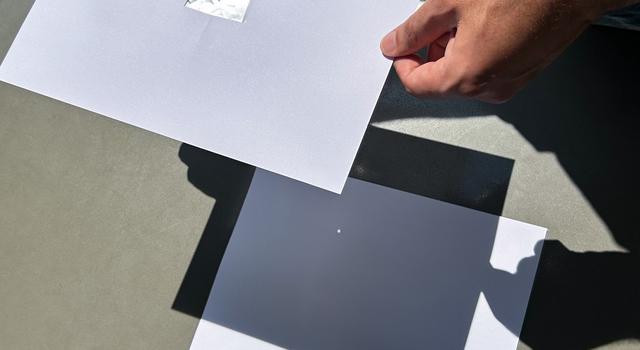
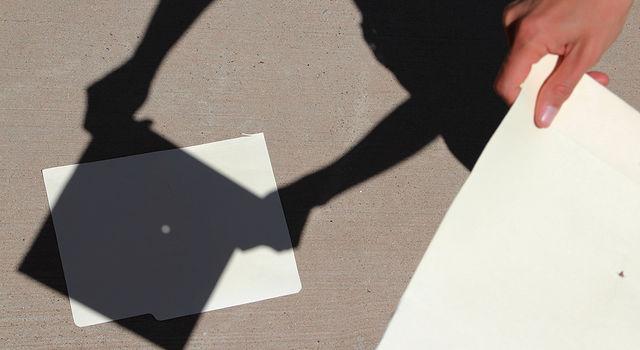
It is important to keep your eclipse glasses on during all parts of the partial solar eclipse. The visible part of the Sun is tens of thousands of times brighter than what you see during totality. You can also use a pinhole camera to view the eclipse.
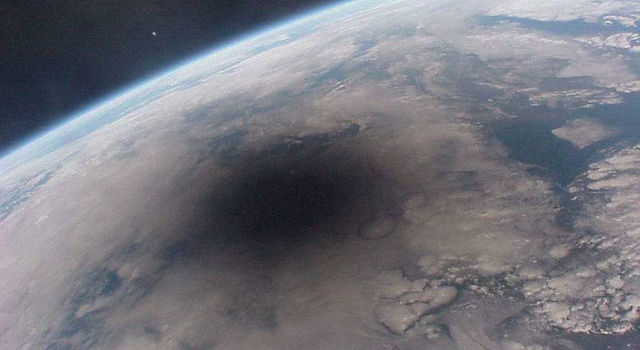
An approximately 115-mile-wide strip known as the path of totality is where the shadow of the Moon, or umbra, will fall on Earth. Inside this path, totality will be visible starting about 65 to 75 minutes after the eclipse begins.
If you are in the path of totality, it is safe to take off your eclipse glasses and look at the total eclipse only during totality. Be sure to put your glasses back on before the total phase ends and the surface of the Sun becomes visible again. Your viewing location during the eclipse will determine how long you can see the eclipse in totality. In the U.S., viewers can expect to see 3.5 to 5.5 minutes of totality.
After totality ends, a partial eclipse will continue for 60 to 80 minutes, ending when the edge of the Moon moves off of the disk of the Sun.
For more information about the start of the partial eclipse, the start and duration of totality, and the percentage of the Sun eclipsed outside the path of totality, find your location on this eclipse map.
On April 8, NASA Television will host a live broadcast featuring expert commentary and views from telescopes along the path of totality. Tune into the broadcast from 10 a.m. to 1 p.m. PDT (1 to 4 p.m. EDT) on the day of the eclipse.
Join NASA as a total solar eclipse moves across North America on April 8. Tune in from 10 a.m. to 1 p.m. PDT (1 to 4 p.m. EDT) for live views from across the path, expert commentary, live demos, and more. | Watch on YouTube
What Solar Eclipses Mean for Science
Solar eclipses provide a unique opportunity for scientists to study the Sun and Earth from land, air, and space, plus allow the public to engage in citizen science!
NASA’s Solar and Heliospheric Observatory, or SOHO, constantly observes the outer regions of the Sun’s corona using a coronagraph. Image credit: ESA/NASA/SOHO | + Expand image
Scientists measure incoming solar radiation, also known as insolation, to better understand Earth’s radiation budget – the energy emitted, reflected, and absorbed by our planet. Just as clouds block sunlight and reduce insolation, eclipses create a similar phenomenon, providing a great opportunity to study how increased cloud cover can impact weather and climate.
Solar eclipses can also help scientists study solar radiation in general and the structure of the Sun. On a typical day, the bright surface of the Sun, called the photosphere, is the only part of the Sun we can see. During a total solar eclipse, the photosphere is completely blocked by the Moon, leaving the outer atmosphere of the Sun (corona) and the thin lower atmosphere (chromosphere) visible. Studying these regions of the Sun’s atmosphere can help scientists understand solar radiation, why the corona is hotter than the photosphere, and the process by which the Sun sends a steady stream of material and radiation into space. Annular solar eclipses provide opportunities for scientists to practice their observation methods so that they'll be ready when a total solar eclipse comes around.
Citizen scientists can get involved in collecting data and participating in the scientific process during the eclipse through NASA’s GLOBE program. Anyone in the path of the eclipse and in partial eclipse areas can act as citizen scientists by measuring temperature and cloud cover data and report it using the GLOBE Observer app to help further the study of how eclipses affect Earth’s atmosphere.
Visit NASA's Eclipse Science page to learn more about the many ways scientists are using the eclipse to improve their understanding of Earth, the Moon, and the Sun.
Taking Eclipse Science Farther
Eclipses also make a great jumping-off point to concepts and techniques used in astrophysics and our search for planets beyond our solar system.
Similar to a solar eclipse, a transit occurs when a planet crosses in front of the face of a star. From Earth, the planets Venus and Mercury can occasionally be seen transiting in front of the Sun, appearing as small, dark dots. Transits are also useful for detecting exoplanets – distant planets around other stars. When an exoplanet passes in between its star and Earth, we can measure tiny dips in the star's brightness that tell scientists a planet is there even when it’s too small to see.
Another way that eclipse concepts are used for astrophysics is with coronagraphs, mechanisms inside telescopes that block the light from a star. By creating a sort of artificial eclipse, coronagraphs help scientists search for exoplanets by making much dimmer planets orbiting a star easier to see. For example, NASA’s Nancy Grace Roman Telescope, slated for launch later this decade, will use an advanced coronagraph to analyze and directly image planets that orbit other stars. Learn more about the astrophysics involved in eclipses, including the use of gravitational lensing to study background objects, from NASA’s Universe of Learning.
Learn how the coronagraph instrument on the Nancy Grace Roman Telescope will allow the spacecraft to peer at the universe through some of the most sophisticated sunglasses ever designed. | Watch on YouTube
Solar Eclipse Lessons and Projects
Use these standards-aligned lessons, plus related activities and resources, to get your students excited about the eclipse and the science that will be conducted during the eclipse.
-
 Student Project
How to Make a Pinhole Camera
Learn how to make your very own pinhole camera to safely see a solar eclipse in action from anywhere the eclipse is visible, partial or full!
Subject Science
Grades K-12
Time < 30 mins
-
 Collection
NASA's Universe of Learning – Eclipse Resources
Explore a curated collection of resources to expand student learning around the eclipse to related astrophysics concepts.
-
 Lesson
Moon Phases
Students learn about the phases of the Moon by acting them out. In 30 minutes, they will act out one complete, 30-day, Moon cycle.
Subject Science
Grades 1-6
Time 30-60 mins
-
 Lesson
Model a Solar Eclipse
Students use simple materials to model a partial, annular, and total solar eclipse.
Subject Science
Grades 1-8
Time 30-60 mins
-
 Lesson
Measuring Solar Energy During an Eclipse
Students use mobile devices to measure the impact a solar eclipse has on the energy received at Earth’s surface.
Subject Math
Grades 4-7
Time 1-2 hrs
-
 Lesson
Modeling the Earth-Moon System
Students learn about scale models and distance by creating a classroom-size Earth-Moon system.
Subject Science
Grades 6-8
Time 30-60 mins
-
 Math Problem
Epic Eclipse
Students use the mathematical constant pi to approximate the area of land covered by the Moon’s shadow during the eclipse.
Subject Math
Grades 6-12
Time < 30 mins
-
 Math Problem
Eclipsing Enigma
Students use pi to figure out how much of the Sun’s disk will be covered by the Moon during an eclipse and whether it’s a total or annular eclipse.
Subject Math
Grades 7-12
Time < 30 mins
-
 Mobile App
NASA GLOBE Observer App
Students can become citizen scientists and collect data for NASA’s GLOBE Program using this app available for iOS and Android devices.
Explore More
Eclipse Info
- NASA Eclipses Website
- Calendar of Past and Upcoming Eclipses
- Downloadable Eclipse Map
- NASA HEAT Eclipse Training Slide Decks
Eclipse Safety
Interactives
Citizen Science
Facts & Figures
NASA's Universe of Learning materials are based upon work supported by NASA under award number NNX16AC65A to the Space Telescope Science Institute, working in partnership with Caltech/IPAC, Center for Astrophysics | Harvard & Smithsonian, and the Jet Propulsion Laboratory.
TAGS: Solar Eclipse, Eclipse, Annular Eclipse, K-12 Education, Lessons, Classroom Resources, STEM Resources

Teachable Moments | March 7, 2024
A Prime Year for NASA's Pi Day Challenge

Learn how pi is used by NASA and how many of its infinite digits have been calculated, then explore the science and engineering behind the 2024 Pi Day Challenge.
Update: March 15, 2024 – The answers to the 2024 NASA Pi Day Challenge are here! Take a peek at the illustrated answer key now available under each problem on the NASA Pi Day Challenge page.
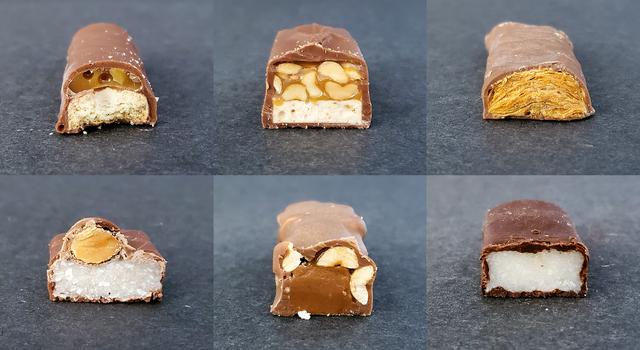
This year marks the 11th installment of the NASA Pi Day Challenge. Celebrated on March 14, Pi Day is the annual holiday that pays tribute to the mathematical constant pi – the number that results from dividing any circle's circumference by its diameter.
Every year on March 14, Pi Day gives us a reason to enjoy our favorite sweet and savory pies and celebrate the mathematical wonder that helps NASA explore the universe. Students can join in the fun once again by using pi to explore Earth and space themselves with the NASA Pi Day Challenge.
Read on to learn more about the science behind this year's challenge and get students solving real problems faced by NASA scientists and engineers exploring Earth, the Moon, asteroids, and beyond!
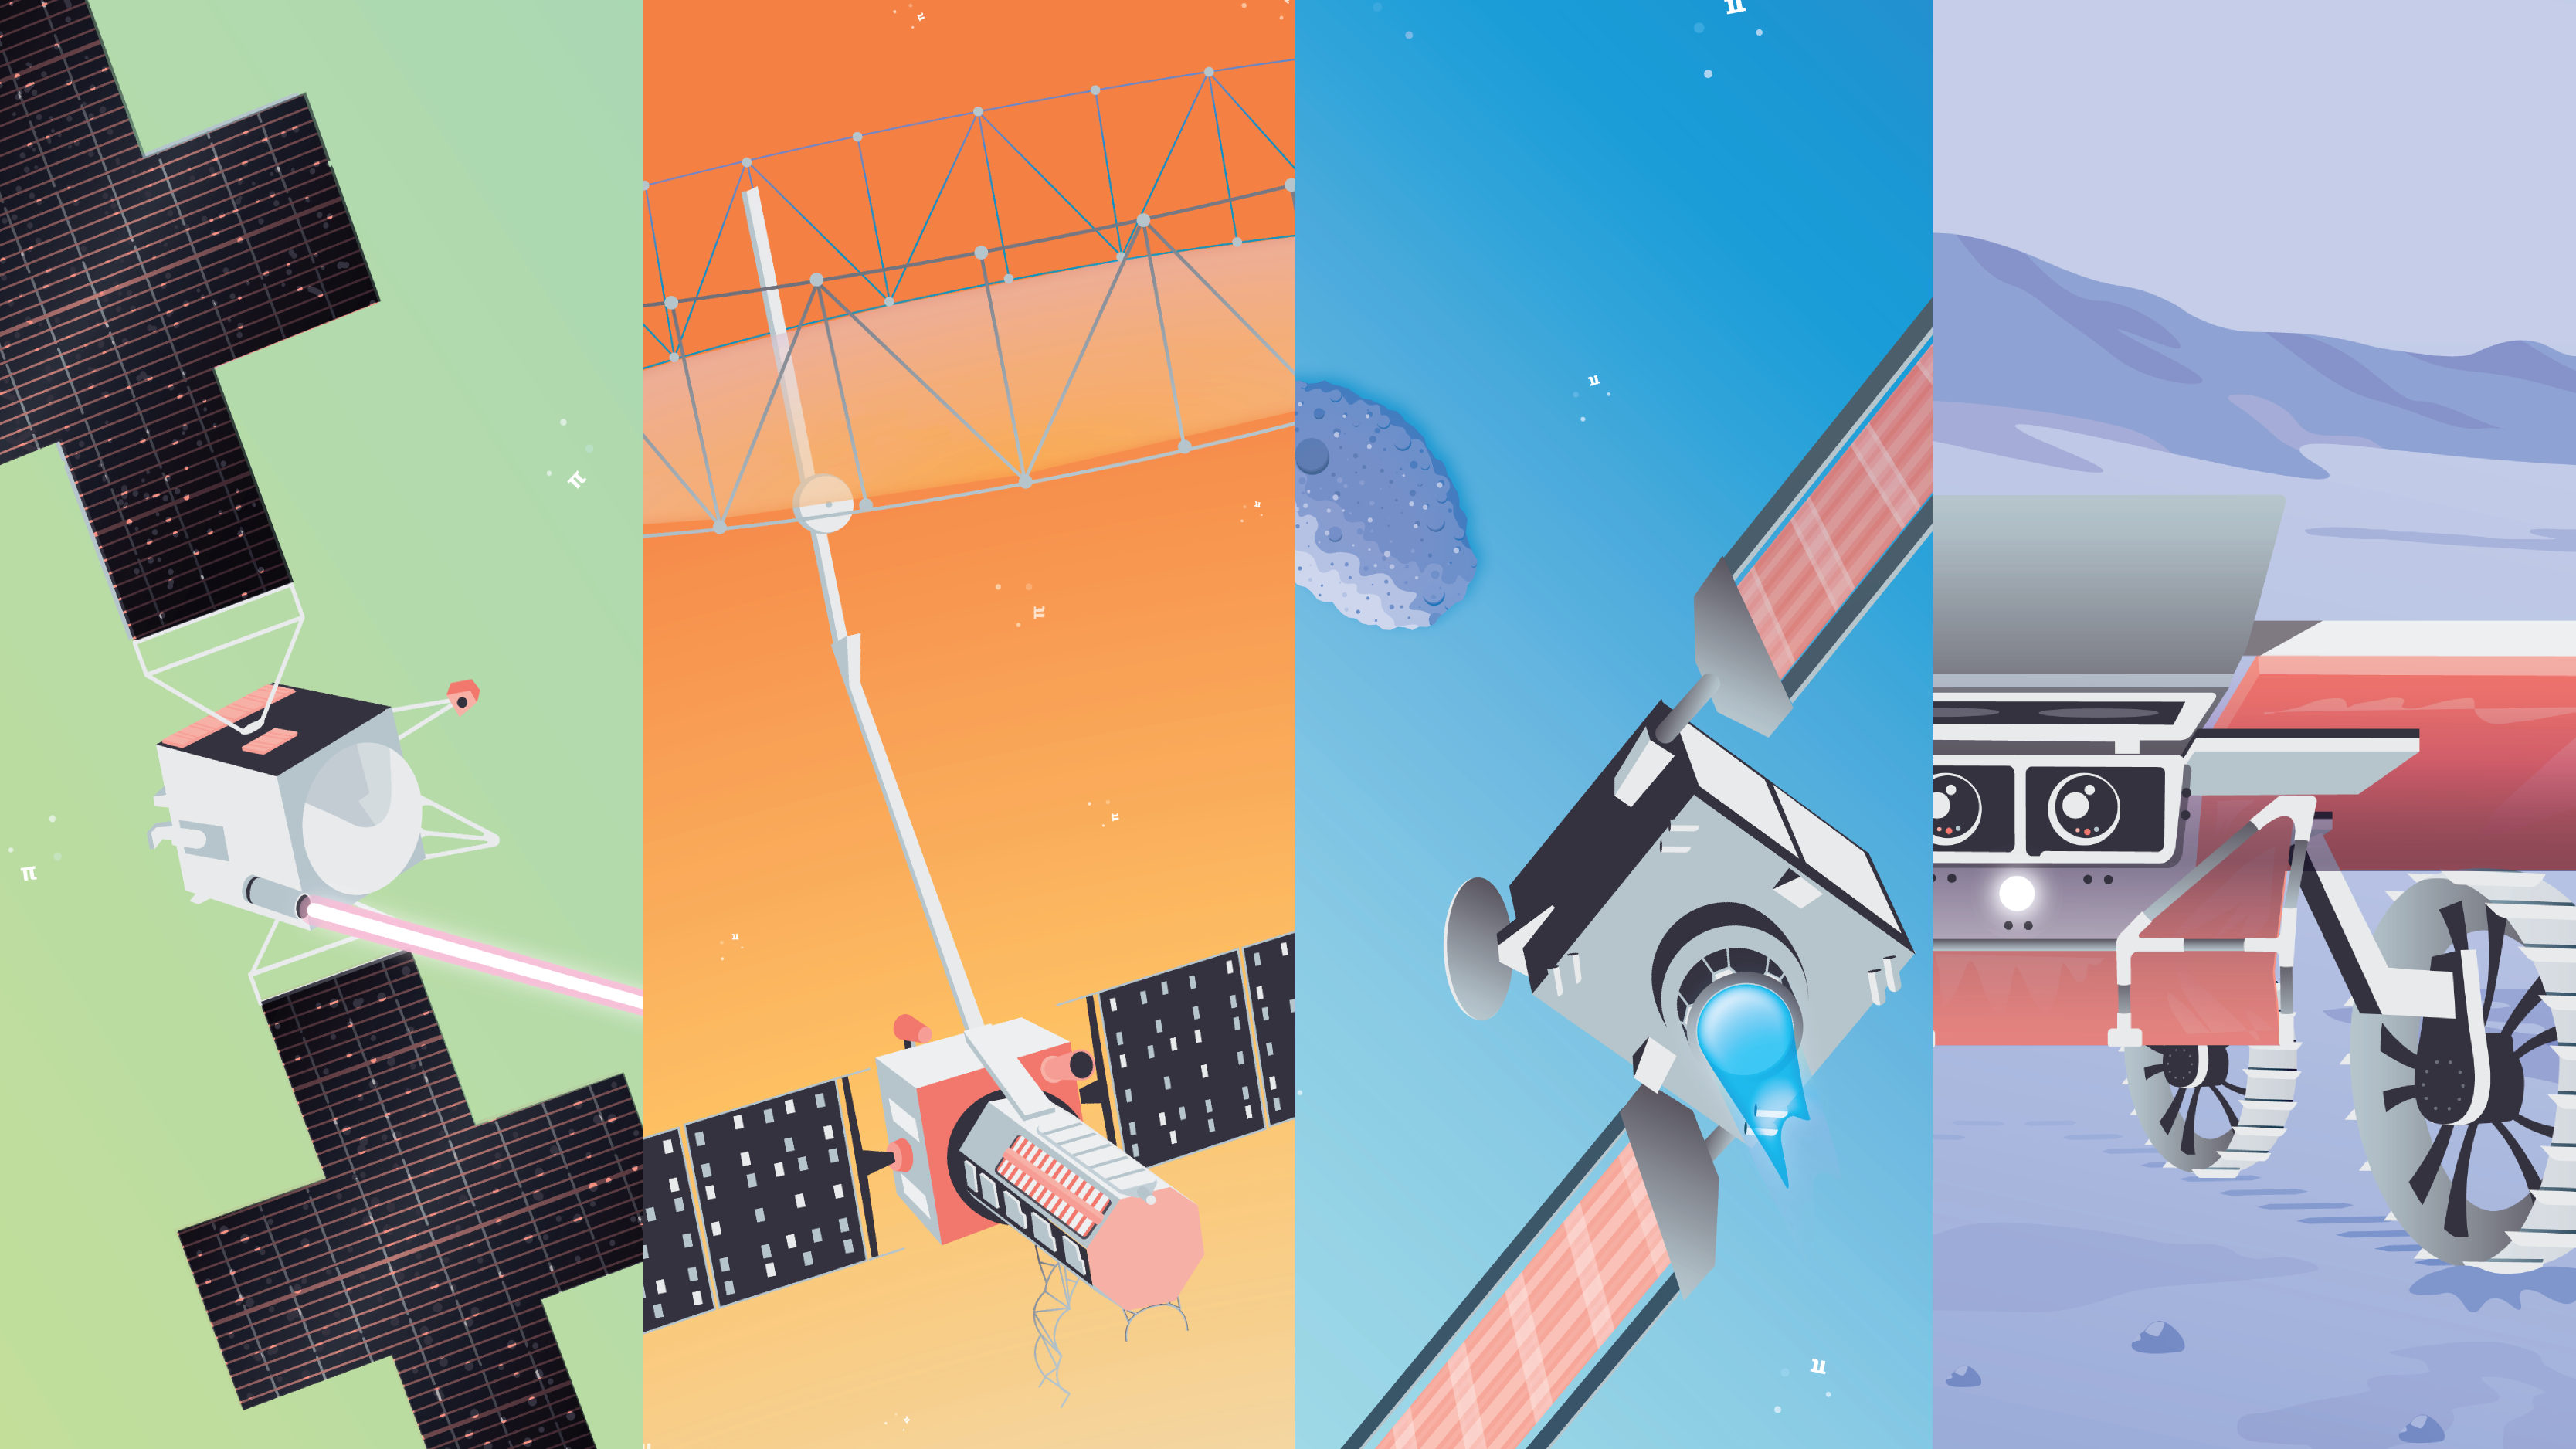
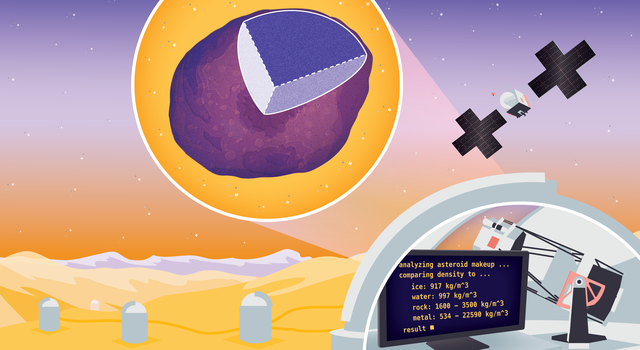
Visit the Pi in the Sky 11 lesson page to explore classroom resources and downloads for the 2024 NASA Pi Day Challenge. Image credit: NASA/JPL-Caltech | + Expand image
What is Pi
Dividing any circle’s circumference by its diameter gives you an answer of pi, which is usually rounded to 3.14. Because pi is an irrational number, its decimal representation goes on forever and never repeats. In 2022, mathematician Simon Plouffe discovered the formula to calculate any single digit of pi. In the same year, teams around the world used cloud computing technology to calculate pi to 100 trillion digits. But you might be surprised to learn that for space exploration, NASA uses far fewer digits of pi.
Here at NASA, we use pi to map the Moon, measure Earth’s changing surface, receive laser-coded messages from deep space, and calculate asteroid orbits. But pi isn’t just used for exploring the cosmos. Since pi can be used to find the area or circumference of round objects and the volume or surface area of shapes like cylinders, cones, and spheres, it is useful in all sorts of ways. Transportation teams use pi when determining the size of new subway tunnels. Electricians can use pi when calculating the current or voltage passing through circuits. And you might even use pi to figure out how much fencing is needed around a circular school garden bed.
In the United States, March 14 can be written as 3.14, which is why that date was chosen for celebrating all things pi. In 2009, the U.S. House of Representatives passed a resolution officially designating March 14 as Pi Day and encouraging teachers and students to celebrate the day with activities that teach students about pi. And that's precisely what the NASA Pi Day Challenge is all about!
The Science Behind the 2024 NASA Pi Day Challenge
This 11th installment of the NASA Pi Day Challenge includes four illustrated math problems designed to get students thinking like scientists and engineers to calculate how to get a laser message to Earth, the change in an asteroid’s orbit, the amount of data that can be collected by an Earth satellite, and how a team of mini rovers will map portions of the Moon’s surface.
Read on to learn more about the science and engineering behind each problem or click the link below to jump right into the challenge.
› Take the NASA Pi Day Challenge
› Educators, get the lesson here!
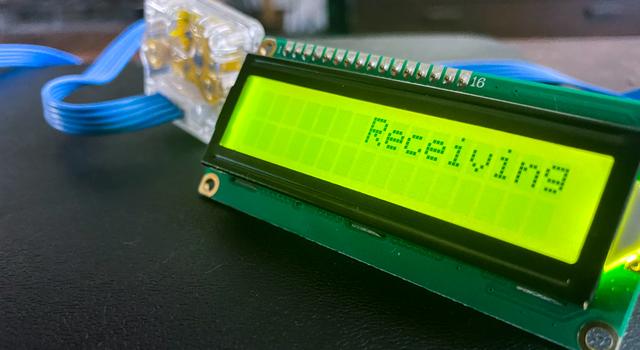
Receiver Riddle
In December 2023, NASA tested a new way to communicate with distant spacecraft using technology called Deep Space Optical Communications, or DSOC. From 19,000,000 miles (30,199,000 km) away, the Psyche spacecraft beamed a high-definition video encoded in a near-infrared laser to Earth. The video, showing a cat named Taters chasing a laser, traveled at the speed of light, where it was received at Caltech’s Palomar Observatory. Because of the great distance the laser had to travel, the team needed to aim the transmission at where Earth would be when the signal arrived. In Receiver Riddle, use pi to determine where along Earth's orbit the team needed to aim the laser so that it could be received at the Observatory at the correct moment.
This animation shows how DSOC's laser signals are sent between the Psyche spacecraft and ground stations on Earth - first as a pointing reference to ensure accurate aiming of the narrow laser signal and then as a data transmission to the receiving station. Credit: NASA/JPL-Caltech/ASU| Watch on YouTube
Daring Deflection
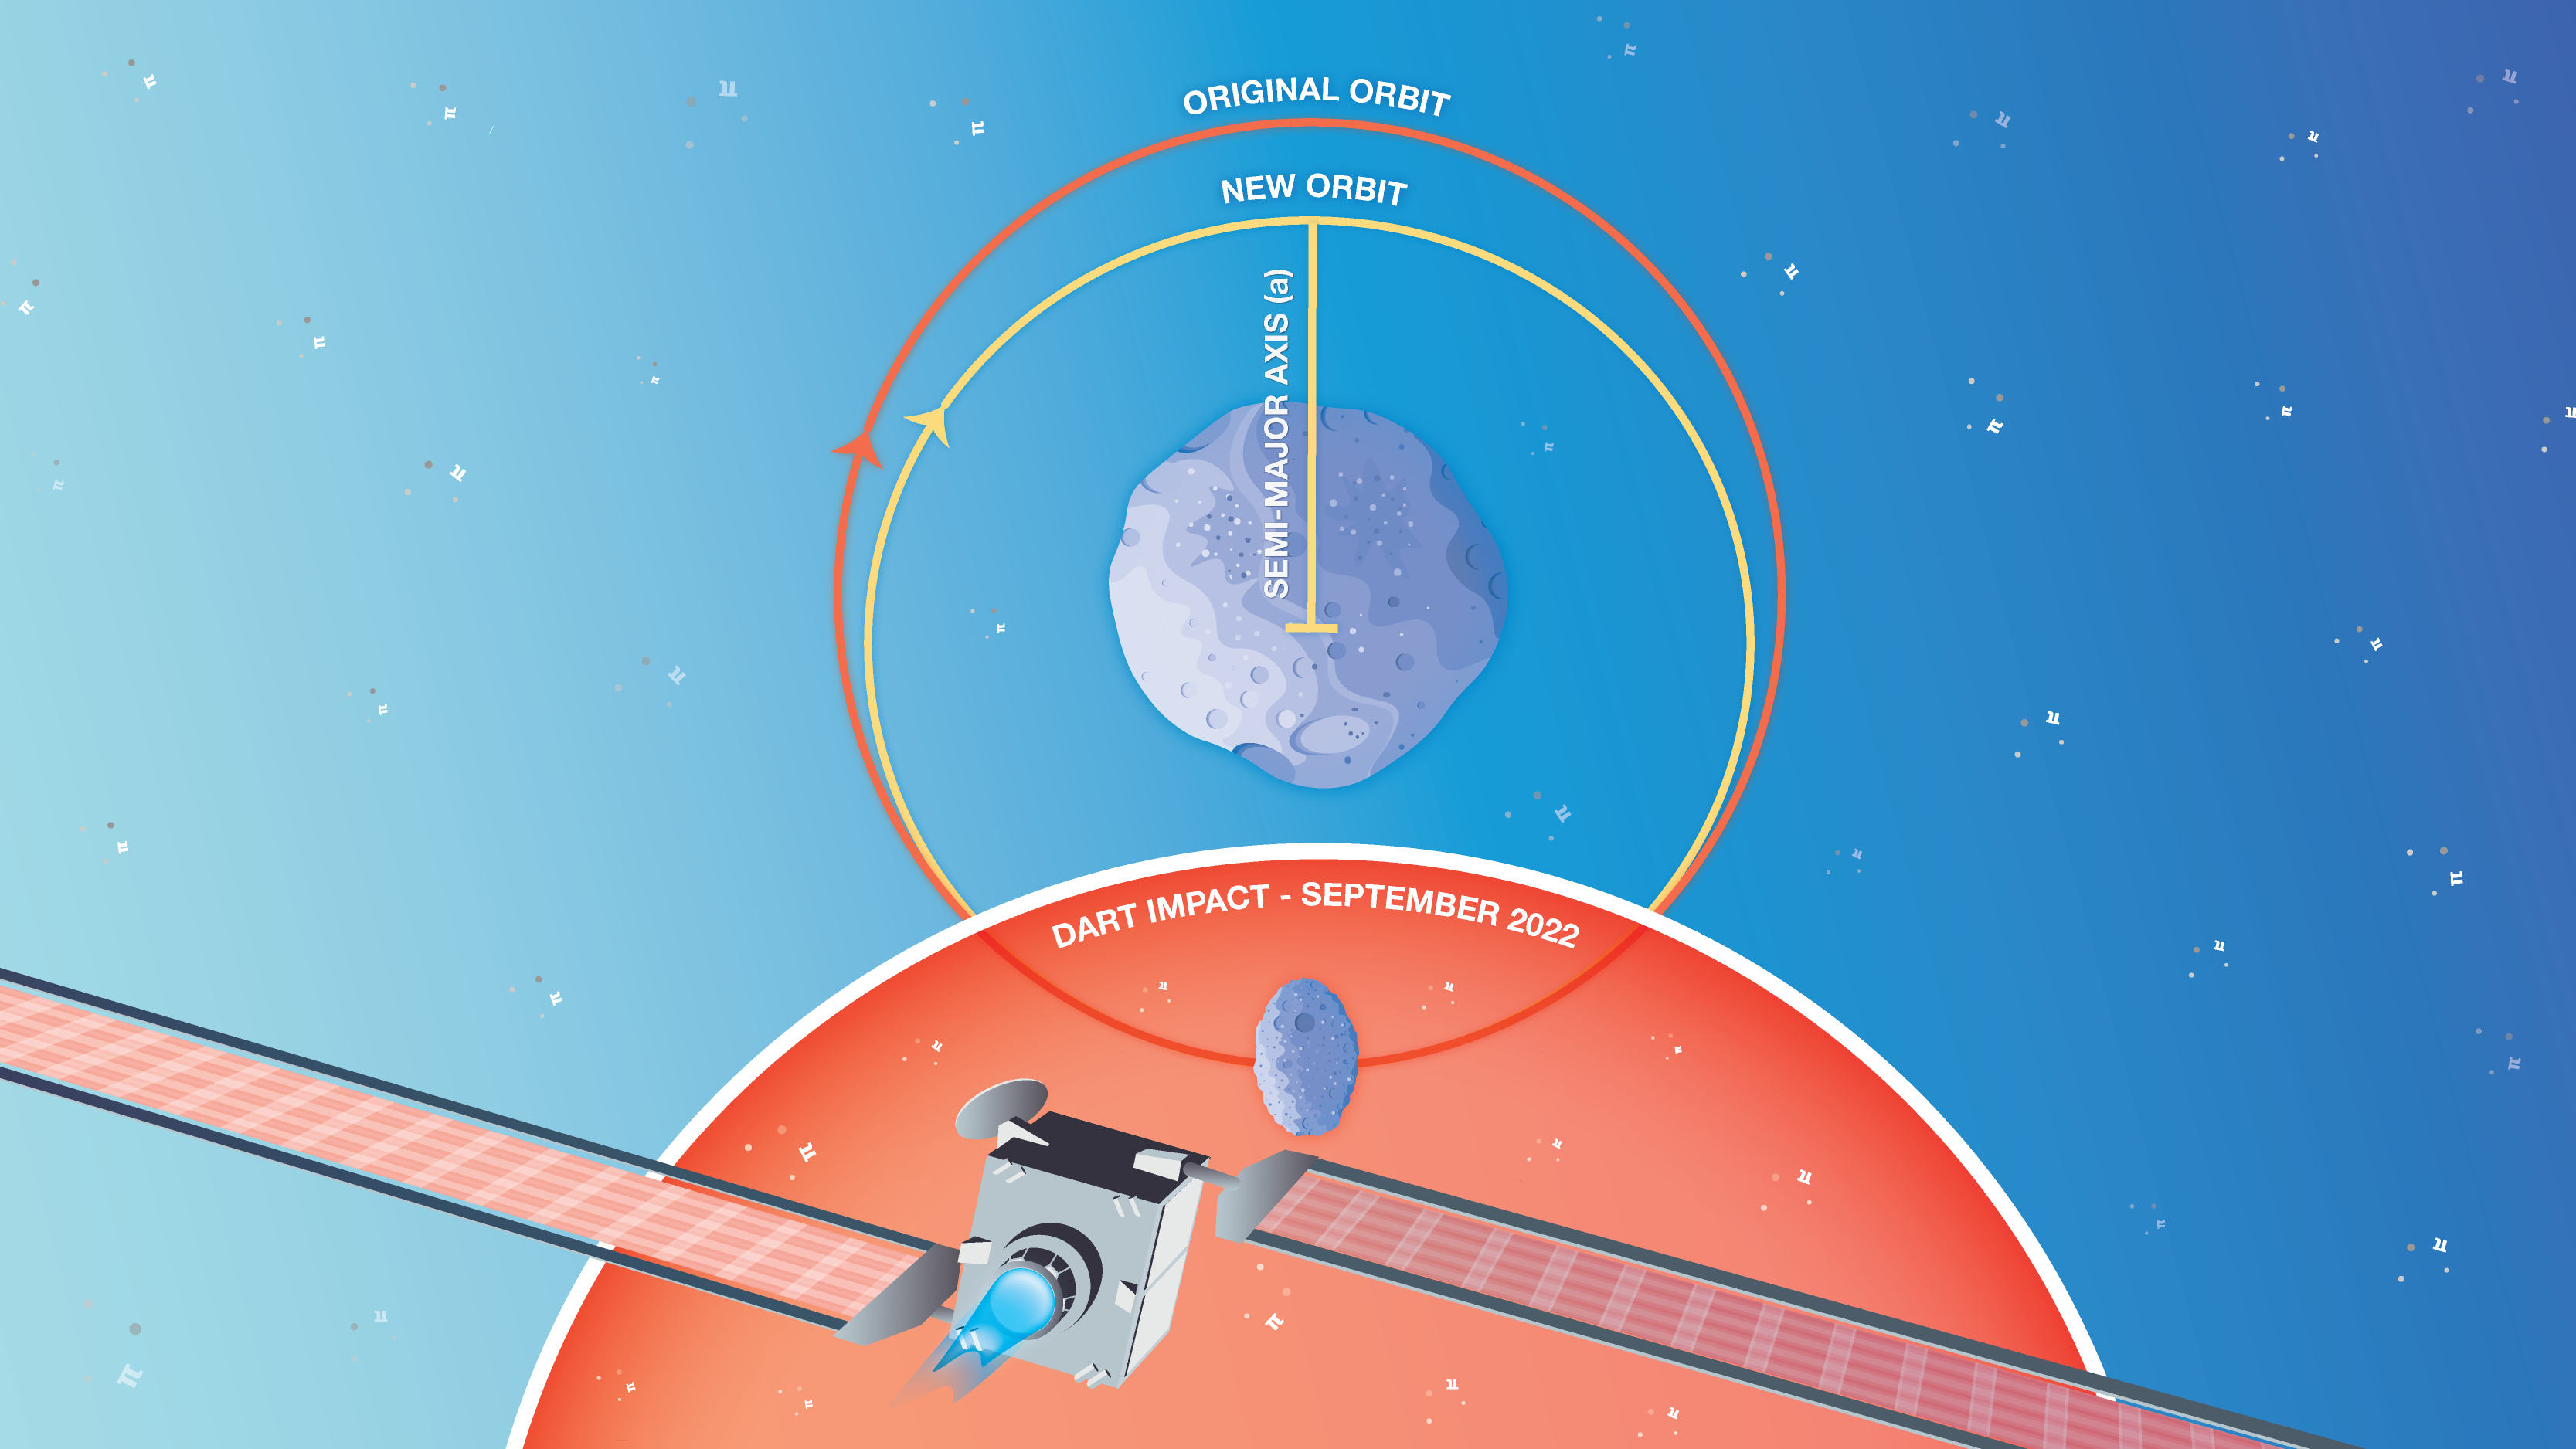
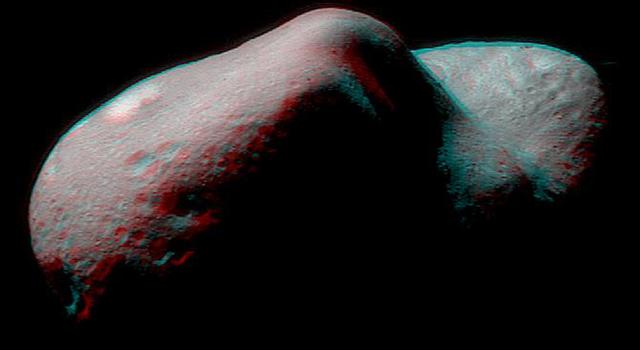
In 2022, NASA crashed a spacecraft into the asteroid Dimorphos in an attempt to alter its orbit. The mission, known as the Double Asteroid Redirection Test, or DART, took place at an asteroid that posed no threat to our planet. Rather, it was an ideal target for NASA to test an important element of its planetary defense plan. DART was designed as a kinetic impactor, meaning it transferred its momentum and kinetic energy to Dimorphos upon impact, altering the asteroid's orbit. In Daring Deflection, use pi to determine the shape of Dimorphos’ orbit after DART crashed into it.

This image shows the final minutes of images leading up to the DART spacecraft's intentional collision with asteroid Dimorphos. Credit: NASA/Johns Hopkins APL | › Enlarge image
Orbit Observation
The NISAR mission is an Earth orbiting satellite designed to study our planet's changing ecosystems. It will collect data about Earth's land- and ice-covered surfaces approximately every 6 days, allowing scientists to study changes at the centimeter scale – an unprecedented level of detail. To achieve this feat, NISAR will collect massive amounts of data. In Orbit Observation, students use pi to calculate how much data the NISAR spacecraft captures during each orbit of Earth.
The NISAR satellite, shown in this artist’s concept, will use advanced radar imaging to provide an unprecedented view of changes to Earth’s land- and ice-covered surfaces. Credit: NASA/JPL-Caltech. | › Full image and caption
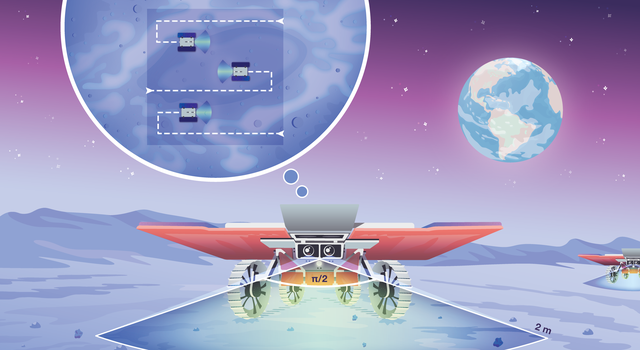
Moon Mappers
The CADRE project aims to land a team of mini rovers on the Moon in 2025 as a test of new exploration technology. Three suitcase-size rovers, each working mostly autonomously, will communicate with each other and a base station on their lunar lander to simultaneously measure data from different locations. If successful, the project could open the door for future multi-robot exploration missions. In Moon Mappers, students explore the Moon with pi by determining how far a CADRE rover drives on the Moon’s surface.
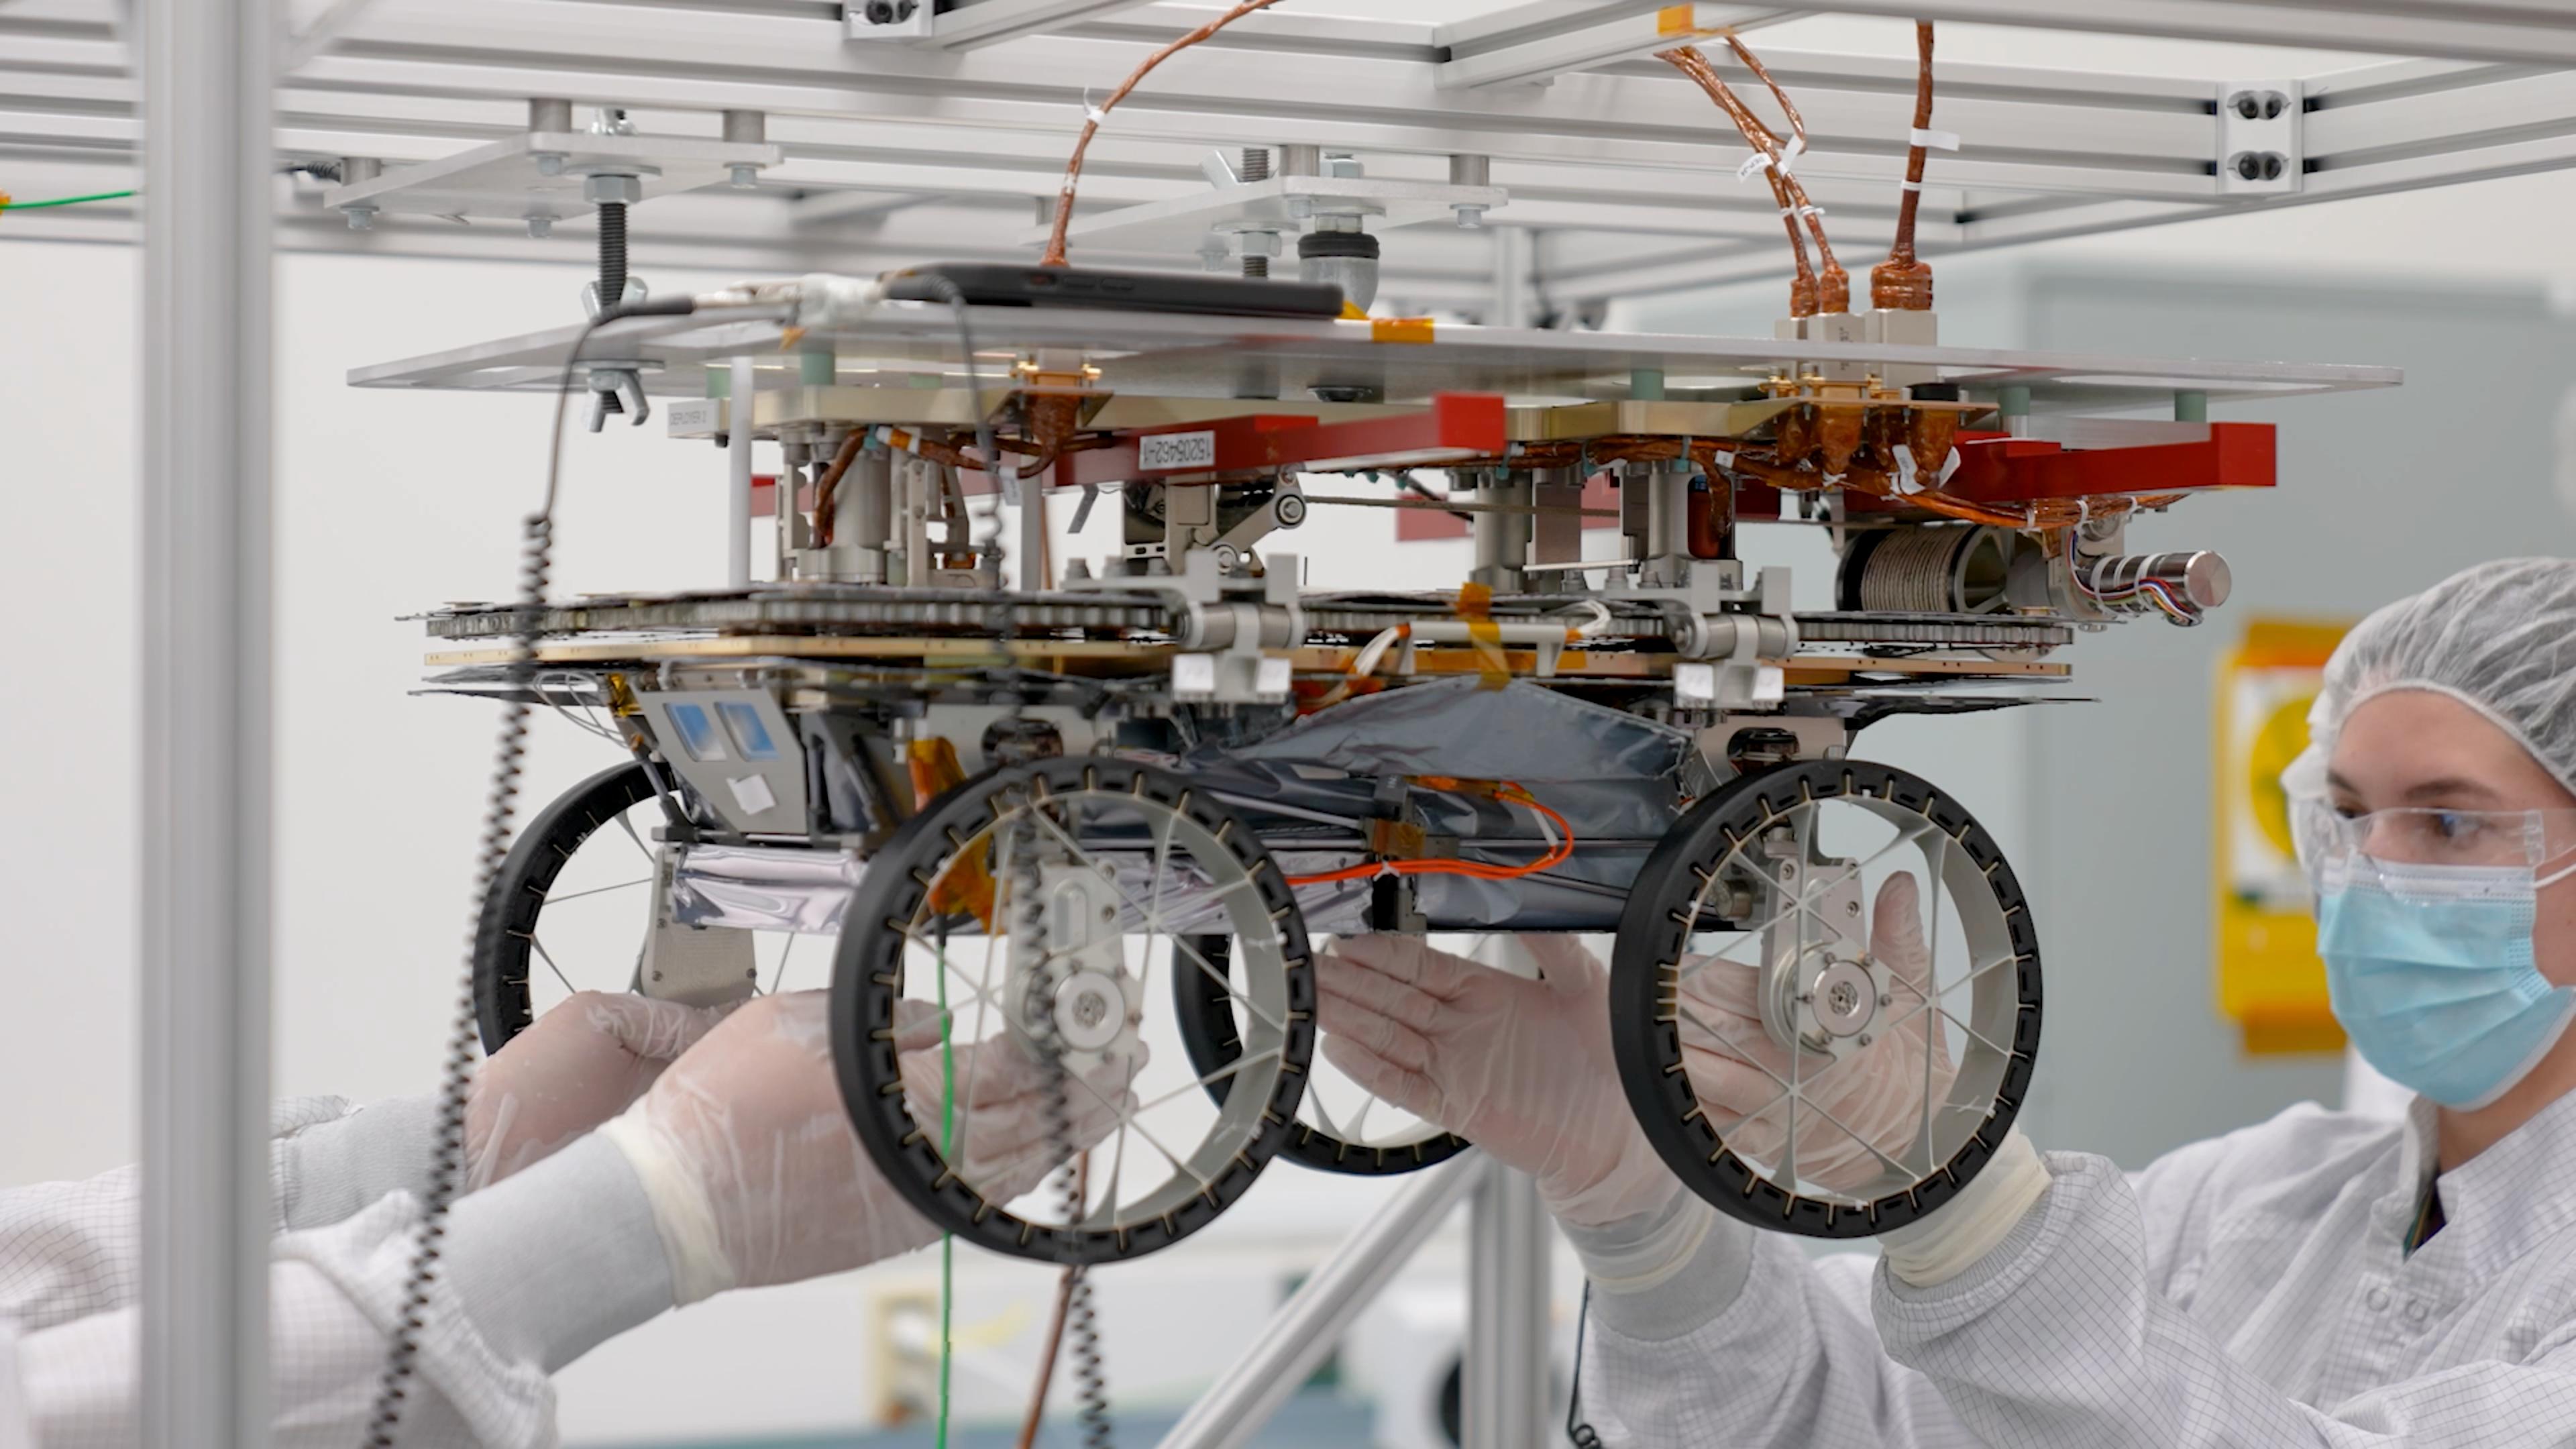
Engineers test the system that will lower three small rovers onto the lunar surface as part of the CADRE project. Credit: NASA/JPL-Caltech | › Full image and caption
Bring the Challenge Into the Classroom
Celebrate Pi Day by getting students thinking like NASA scientists and engineers to solve real-world problems in the NASA Pi Day Challenge. In addition to solving the 2024 challenge, you can also dig into the 40 puzzlers from previous challenges available in our Pi Day collection. Completing the problem set and reading about other ways NASA uses pi is a great way for students to see the importance of the M in STEM.
-
 Collection
Educator Guides – NASA Pi Day Challenge
Here's everything you need to bring the NASA Pi Day Challenge into the classroom.
Grades 4-12
Time Varies
-
 Student Activity
NASA Pi Day Challenge
The entire NASA Pi Day Challenge collection can be found in one, handy collection for students.
Grades 4-12
Time Varies
-
Downloads
Can't get enough pi? Download this year's NASA Pi Day Challenge graphics, including mobile phone and desktop backgrounds:
More Pi Resources
-
 Article
How Many Decimals of Pi Do We Really Need?
While you may have memorized more than 70,000 digits of pi, world record holders, a JPL engineer explains why you really only need a tiny fraction of that for most calculations.
-
 Article
18 Ways NASA Uses Pi
Whether it's sending spacecraft to other planets, driving rovers on Mars, finding out what planets are made of or how deep alien oceans are, pi takes us far at NASA. Find out how pi helps us explore space.
- Article
10 Ways to Celebrate Pi Day With NASA on March 14
Find out what makes pi so special, how it’s used to explore space, and how you can join the celebration with resources from NASA.
-
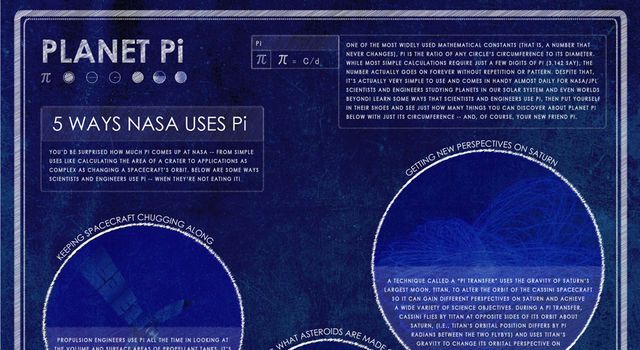 Infographic
Planet Pi
This poster shows some of the ways NASA scientists and engineers use the mathematical constant pi (3.14) and includes common pi formulas.
-
 Article
18 Maneras en Que la NASA Usa Pi
Pi nos lleva lejos en la NASA. Estas son solo algunas de las formas en que pi nos ayuda a explorar el espacio.

Related Lessons for Educators
-
 Lesson
Collisions in Space
Students predict and observe what happens when two objects collide to model collisions in space.
Grades K-4
Time 30 min to 1 hour
- Lesson
Moon Phases
Students learn about the phases of the moon by acting them out.
Grades 1-6
Time 30 min to 1 hour
-
 Lesson
Modeling an Asteroid
Lead a discussion about asteroids and their physical properties, then have students mold their own asteroids out of clay.
Grades 3-5
Time 30 min to 1 hour
-
 Lesson
Math Rocks: A Lesson in Asteroid Dynamics
Students use math to investigate a real-life asteroid impact.
Grades 8-12
Time 30 min to 1 hour
- Lesson
Modeling Crustal Folds
Students use playdough to model how Earth’s crust is bent and folded by tectonic plates over geologic time.
Grades 6-12
Time 30 min to 1 hour
- Lesson
Making Topographic Maps
Students draw and interpret topographic maps while learning about technology used to map Earth's surface, the seafloor, and other worlds.
Grades 6-12
Time 30 min to 1 hour
-
 Lesson
Code a Radio Message for Space
Students code microcontrollers to send and receive radio signals, simulating communications between Earth and spacecraft.
Grades 6-12
Time 30 min to 1 hour
Related Activities for Students
-
 Student Project
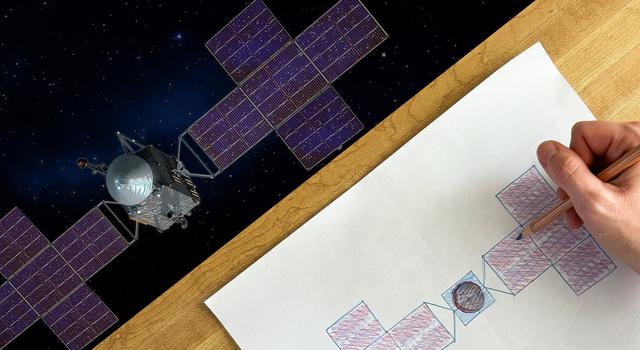
Draw Your Own Psyche Spacecraft
Follow these easy instructions to draw and decorate your own model of the Psyche spacecraft.
Type Project
Subject Engineering
-
 Slideshow
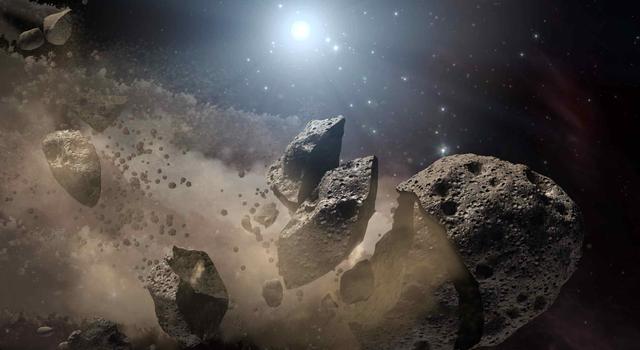
What's That Space Rock?
Find out how to tell the difference between asteroids, comets, meteors, meteorites and other bodies in our solar system.
Type Slideshow
Subject Science
Facts and Figures
Websites
Articles
- How NASA Studies and Tracks Asteroids Near and Far
- NASA Cat Video Explained
- Article for Kids: Asteroid or Meteor: What's the Difference?
- Article for Kids: What Is an Asteroid?
Videos
- The Video NASA’s Laser Communications Experiment Streamed From Deep Space
- NASA's DART Mission Confirms Crashing Spacecraft into Asteroids Can Deflect Them
Interactives
TAGS: Pi Day, Pi, Math, NASA Pi Day Challenge, moon, earth, asteroid, psyche, DART, CADRE, NISAR DSOC
Teachable Moments | January 29, 2024
The NASA Cat Video Explained

Find out how the now famous video beamed from space, showing a cat chasing a laser, marked a milestone for space exploration, and find resources to engage students in related STEM learning.
You may have seen in the news last month that NASA beamed a cat video from space. It was all part of a test of new technology known as Deep Space Optical Communications. While the video went down in cat video history, the NASA technology used to transmit the first ultra-high-definition video from deep space also represented a historic advancement for space exploration – the potential to stream videos from the Moon, Mars, and beyond.
Read on to learn how this new technology will revolutionize space communications. Then, explore STEM learning resources that will get students using coding, math, and engineering to explore more about how NASA communicates with spacecraft.
Why did NASA beam a cat video from space?
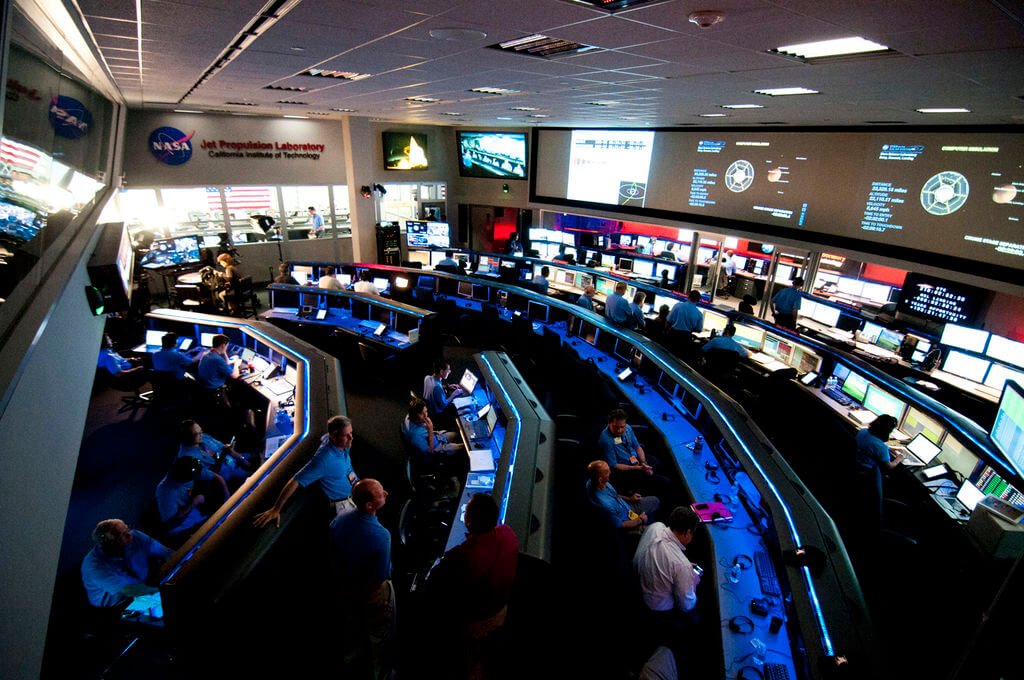
Communicating with spacecraft across the solar system means sending data – such as commands, images, measurements, and status reports – over enormous distances, with travel times limited by the speed of light. NASA spacecraft have traditionally used radio signals to transmit information to Earth via the Deep Space Network, or DSN. The DSN is made up of an array of giant antennas situated around the globe (in California, Spain, and Australia) that allow us to keep in contact with distant spacecraft as Earth rotates.
When scientists and engineers want to send commands to a spacecraft in deep space, they turn to the Deep Space Network, NASA’s international array of giant antennas. | Watch on YouTube
Although sending transmissions using radio frequencies works well, advances in spacecraft technology mean we're collecting and transmitting a lot more data than in the past. The more data a spacecraft collects and needs to transmit to Earth, the more time it takes to transmit that data. And with so many spacecraft waiting to take their turn transmitting via the DSN's antennas, a sort of data traffic jam is on the horizon.
This interactive shows a real-time simulated view of communications between spacecraft and the DSN. Explore more on DSN Now
To alleviate the potential traffic jam, NASA is testing technology known as optical communications, which allows spacecraft to send and receive data at a higher information rate so that each transmission takes less of the DSN’s time.
The technology benefits scientists and engineers – or anyone who is fascinated by space – by allowing robotic spacecraft exploring planets we can't yet visit in person to send high-definition imagery and stream video to Earth for further study. Optical communications could also play an important role in upcoming human missions to the Moon and eventually to Mars, which will require a lot of data transmission, including video communication.
But why transmit a video of a cat? For a test of this kind, engineers would normally send randomly generated test data. But, in this case, to mark what was a significant event for the project, the team at NASA's Jet Propulsion Laboratory worked with the center's DesignLab to create a fun video featuring the pet of a JPL employee – a now famous orange tabby named Taters – chasing a laser. The video was also a nod to the project's use of lasers (more on that in a minute) and the first television test broadcast in 1928 that featured a statue of the cartoon character Felix the Cat.
This 15-second ultra-high-definition video featuring a cat named Taters was streamed via laser from deep space by NASA on Dec. 11, 2023. | Watch on YouTube
How lasers improve spacecraft communications
The NASA project designed to test this new technology is known as Deep Space Optical Communications, or DSOC. It aims to prove that we can indeed transmit data from deep space at a higher information rate.
To improve upon the rate at which data flows between spacecraft and antennas on Earth, DSOC uses laser signals rather than the radio signals currently used to transmit data. Radio signals and laser signals are both part of the electromagnetic spectrum and travel at the same speed – the speed of light – but they have different wavelengths. The DSOC lasers transmit data in the near-infrared portion of the electromagnetic spectrum, so their wavelength is shorter than radio waves, and they have a higher frequency.
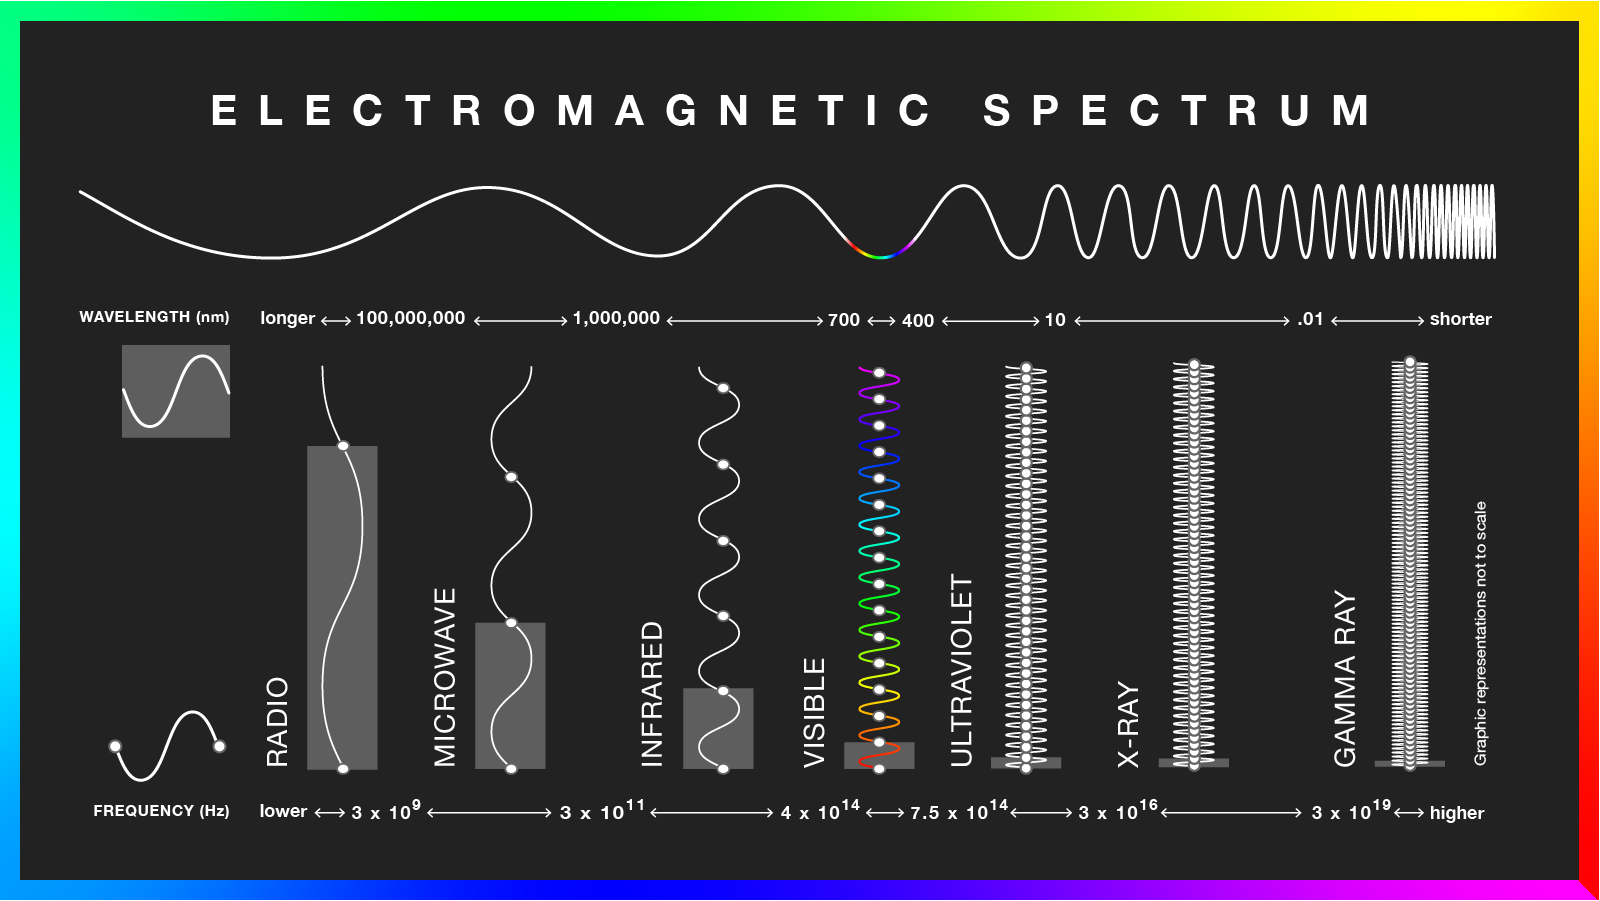
This chart compares the wavelength and frequency range of each kind of wave on the electromagnetic spectrum. Note: The graphic representations are not to scale. Image credit: NASA/JPL-Caltech | + Expand image | › Download low-ink version for printing
Since there are more infrared than radio wavelengths over a particular distance, more data can be sent over the same distance using infrared. And since the speed of infrared and radio waves is equal to the speed of light, this also means that more data can be sent in the same length of time using infrared.
As a result, DSOC’s maximum information rate is around 267 megabits per second (Mbps), faster than many terrestrial internet signals. At that high data rate, the 153.6 megabit cat video took only 0.58 seconds to transmit and another 101 seconds to travel the 19 million miles to Earth at the speed of light. Instead, if we had sent the cat video using Psyche's radio transmitter, which has a data rate of 360 kilobits per second, it would have taken 426 seconds to transmit the video, plus the same speed-of-light travel time, to get to Earth.
Here's how DSOC aims to revolutionize deep space communications. | Watch on YouTube
This kind of spacecraft communications isn't without its challenges. Accurately pointing the narrow laser beam is one of the greatest challenges of optical communications.
DSOC consists of a "flight laser transceiver" aboard the Psyche spacecraft – which is currently on its journey to study the asteroid 16-Psyche – and a receiving station on Earth. The flight transceiver is a 22-centimeter-diameter apparatus that can both transmit and receive signals. Its maximum transmitter strength is a low 4 Watts. For the December 2023 test, a 160-Watt beacon signal was transmitted to the DSOC flight transceiver by a 1-meter telescope located at JPL's Table Mountain facility near Wrightwood, California. This beacon signal was used by the Psyche spacecraft as a pointing reference so it could accurately aim the DSOC transceiver at the Earth receiving station – the 5-meter Hale telescope at Caltech’s Palomar Observatory near San Diego.
This animation shows how DSOC's laser signals are sent between the Psyche spacecraft and ground stations on Earth - first as a pointing reference to ensure accurate aiming of the narrow laser signal and then as a data transmission to the receiving station. | Watch on YouTube
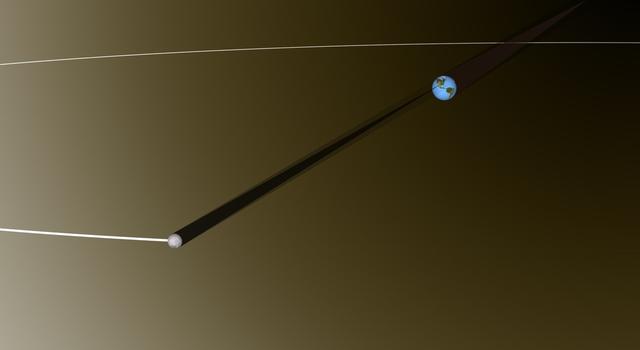
When the DSOC laser beam encounters Earth, it is much narrower than a radio signal transmitted from the same distance. In fact, the laser beam is only a few hundred kilometers wide when it reaches Earth, in sharp contrast with an approximately 2.5-million-kilometer-wide radio signal. This narrow beam must be pointed accurately enough so it not only intersects Earth, but also overlaps the receiving station. To ensure that the beam will be received at Palomar Observatory, the transmission must be aimed not directly at Earth, but at a point where Earth will be in its orbit when the signal arrives after traveling the great distance from the spacecraft.
What's next for laser communications
Engineers will do additional tests of the DSOC system as the Psyche spacecraft continues its 2.2-billion-mile (3.6-billion-kilometer) journey to its destination in the asteroid belt beyond Mars. Over the next couple of years, DSOC will make weekly contacts with Earth. Visit NASA's DSOC website to follow along as NASA puts the system through its paces to potentially usher in a new means of transmitting data through space.
How does the cat video relate to STEM learning?
The DSOC project provides a wonderful opportunity to help students understand the electromagnetic spectrum and learn about real-world applications of STEM in deep space communications. Try out these lessons and resources to get students engaged.
Educator Resources
-
 Collection
DSOC Lessons for Educators
Get students learning more about optical communications with these standards-aligned coding, engineering, and math lessons.
-
 Collection
Space Communications Lessons for Educators
These standards-aligned lessons get students using math and engineering to learn how NASA communicates with distant spacecraft.
-
 Collection
Light and Optics Lessons for Educators
Explore our collection of standards-aligned STEM lessons all about light and optics.
-
 Teachable Moment
Asteroid Mission Aims to Explore Mysteries of Earth's Core
Explore how NASA's Psyche mission aims to help scientists answer questions about Earth and the formation of our solar system. Then, make connections to STEM learning in the classroom.
-
 Expert Talk
Teaching Space With NASA – Engineering the Deep Space Network
NASA experts talk about the system of antennas that make up the Deep Space Network and how it's used to communicate with distant spacecraft and collect science.
-
 Expert Talk
Teaching Space With NASA en Español – La Red del Espacio Profundo de NASA
Un bosquejo de su importancia para la exploración del universo; un esfuerzo en busca de descubrimientos beneficiosos para la humanidad.
Student Resources
-
 Collection
Space Communications Activities for Students
Explore videos and projects for students about the ways NASA communicates with distant spacecraft.
-
 Game
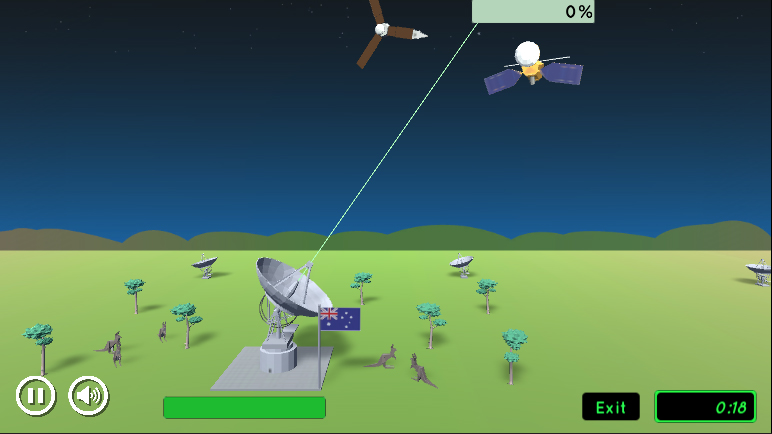
GamePlay DSN Uplink-Downlink
In this game you’ll use these big antennas to send information to — and receive information from — NASA’s robotic explorers in the solar system and beyond.
-
 Student Article
How Does NASA Communicate With Spacecraft?
Get the answer in this article from NASA Space Place.
Explore More
Multimedia
- Image: Explaining the First Ultra-HD Video Sent From Deep Space via Laser
- Public Talk: A Day in the Life of the Deep Space Network
- Infographic: NASA Deep Space Network: Celebrating 50 Years of Communication and Discovery
- JPL Space Images: Deep Space Network
Interactives
Downloads
Websites
- NASA: Deep Space Optical Communications (DSOC)
- NASA: Deep Space Network (DSN)
- NASA Science: Psyche Mission
Articles
- JPL News: NASA's Tech Demo Streams First Video from Deep Space via Laser
- JPL News: 5 Things to Know About NASA's Deep Space Optical Communications
- JPL News: Deep Space Network
TAGS: K-12 Education, Educators, Students, Learning Resources, Teaching Resources, DSOC, DSN, Deep Space Network

Edu News | January 16, 2024
Doing the Math on Why We Have Leap Day

Leap day, Feb. 29, happens every four years because of a mismatch between the calendar year and Earth's orbit. Learn how it works, and get students engaged in leap day STEM.
You may have noticed that there's an extra day on your calendar this year. That's not a typo – it's leap day! Leap day is another name for Feb. 29, a date that typically comes around every four years, during a leap year.
Why doesn't Feb. 29 appear on the calendar every year?
The length of a year is based on how long it takes a planet to revolve around the Sun. Earth takes about 365.2422 days to make one revolution around the Sun. That's about six hours longer than the 365 days that we typically include in a calendar year. As a result, every four years, we have about 24 extra hours that we add to the calendar at the end of February in the form of leap day.
Without leap day, the dates of annual events, such as equinoxes and solstices, would slowly shift to later in the year, changing the dates of each season. After only a century without leap day, summer wouldn’t start until mid-July!
But the peculiar adjustments don't end there. If Earth revolved around the Sun in exactly 365 days and six hours, this system of adding a leap day every four years would need no exceptions. However, Earth takes a little less time than that to orbit the Sun. Rounding up and inserting a 24-hour leap day every four years adds about 45 extra minutes to every four-year leap cycle. That adds up to about three days every 400 years. To correct for that, years that are divisible by 100 don't have leap days unless they’re also divisible by 400.
If you do the math, you'll see that the year 2000 was a leap year, but 2100, 2200 and 2300 will not be.
Have students learn more about leap years with this article from NASA's Space Place, then have them do the math for themselves with this leap day problem set. You can also have students write a letter or poem to be opened on the next leap day or get them learning about orbits across the solar system.
And since we've got an extra 24 hours this year, don't forget to take a little time to relax!
Educator Resources
-
 Problem Set
Leap Day Math
In this problem set, students calculate the difference between the calendar year and Earth's orbital period to determine when leap years occur.
Subject Math
Grades 5-8
Time Less than 30 mins
-
 Collection
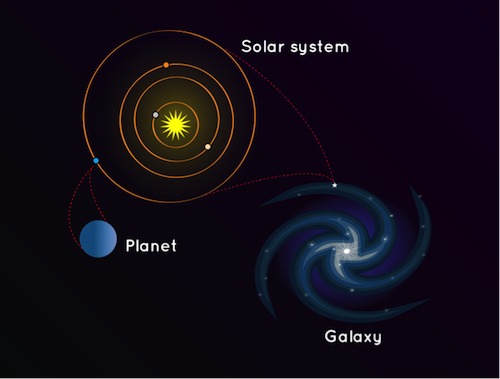
Solar System Scale & Size Lessons
Explore a collection of standards-aligned lessons all about the size and scale of our solar system.
-
 Educator Guide
Planetary Poetry
Have students write a poem they can open and re-read next leap day!
Subject Science
Grades 2-12
Time 1-2 hrs
Student Resources
-
 Article
What Is a Leap Year?
Get the answer in this article from NASA Space Place. Plus, learn if other planets have leap years!
-
 Article
How Long Is a Year on Other Planets?
Get the answer in this article from NASA Space Place.
-
 Collection
All About the Size and Scale of the Solar System
Learn how big and far away the planets are with these projects and activities.
TAGS: K-12 Education, Math, Leap Day, Leap Year, Events, Space, Educators, Teachers, Parents, Students, STEM, Lessons, Earth Science, Earth
Teachable Moments | November 27, 2023
NASA Balloon Mission Designed to See the Space Between Stars

Get to know GUSTO and learn how to bring the science and engineering behind this unique balloon-based mission into the classroom.
A NASA balloon mission designed to study the interstellar medium – the space between stars – will take to the skies above Antarctica in December 2023.
Read on to learn how the GUSTO mission's unique design and science goals can serve as real-life examples of STEM concepts. Then, explore lessons and resources you can use to get students learning more.
What the GUSTO Mission Will Do
Though many people think of space as empty except for things like stars, planets, moons, asteroids, meteors, and comets, it’s anything but. Typically, there is one molecule of matter in every cubic centimeter of the space between stars known as the interstellar medium. In more dense clouds of interstellar gas, there could be as many as 1,000,000 molecules per cubic centimeter. It might not seem like much compared with the 10,000,000,000,000,000,000 molecules in every cubic centimeter of air we breathe, but the interstellar medium can tell us a lot about how stars and planets form and what role gases and dust play in our galaxy and others.

This diagram shows the life cycles of Sun-like and massive stars. Credit: NASA, Night Sky Network | › Learn more about star life cycles
Like plants and animals, stars have a life cycle that scientists want to better understand. Gases and dust grains that make up a dense interstellar cloud, known as a nebula, can become disturbed, and under the pull of their own gravity, begin collapsing in on themselves. Eventually stars form from the gas and planets form from the dust. As a star goes through its life, it eventually runs out of sources of energy. When this happens, the star dies, expelling gases – sometimes violently, as in a supernova – into a new gas cloud. From here, the cycle can start again. Scientists want to know more about the many factors at play in this cycle. This is where GUSTO comes in.
GUSTO – short for Galactic/Extragalactic ULDB Spectroscopic Terahertz Observatory – is a balloon-based telescope that will study the interstellar medium, the small amount of gas and dust between the stars. From its vantage point high above almost all of the Earth’s atmosphere, GUSTO will measure carbon, nitrogen, and oxygen emissions in the far-infrared portion of the electromagnetic spectrum, focusing its sights on the Milky Way galaxy and the nearby galaxy known as the Large Magellanic Cloud.

Our galaxy, the Milky Way, has hundreds of billions of stars and enough gas and dust to make billions more stars. Credit: NASA | › Full image and caption
The mission is designed to provide scientists with data that will help them understand the complete lifecycle of the gas and dust that forms planets and stars. To achieve its goals, GUSTO will study:
- The composition and formation of molecular clouds in these regions.
- The formation, birth, and evolution of stars from molecular clouds.
- The formation of gas clouds following the deaths of stars. And the re-start of this cycle.
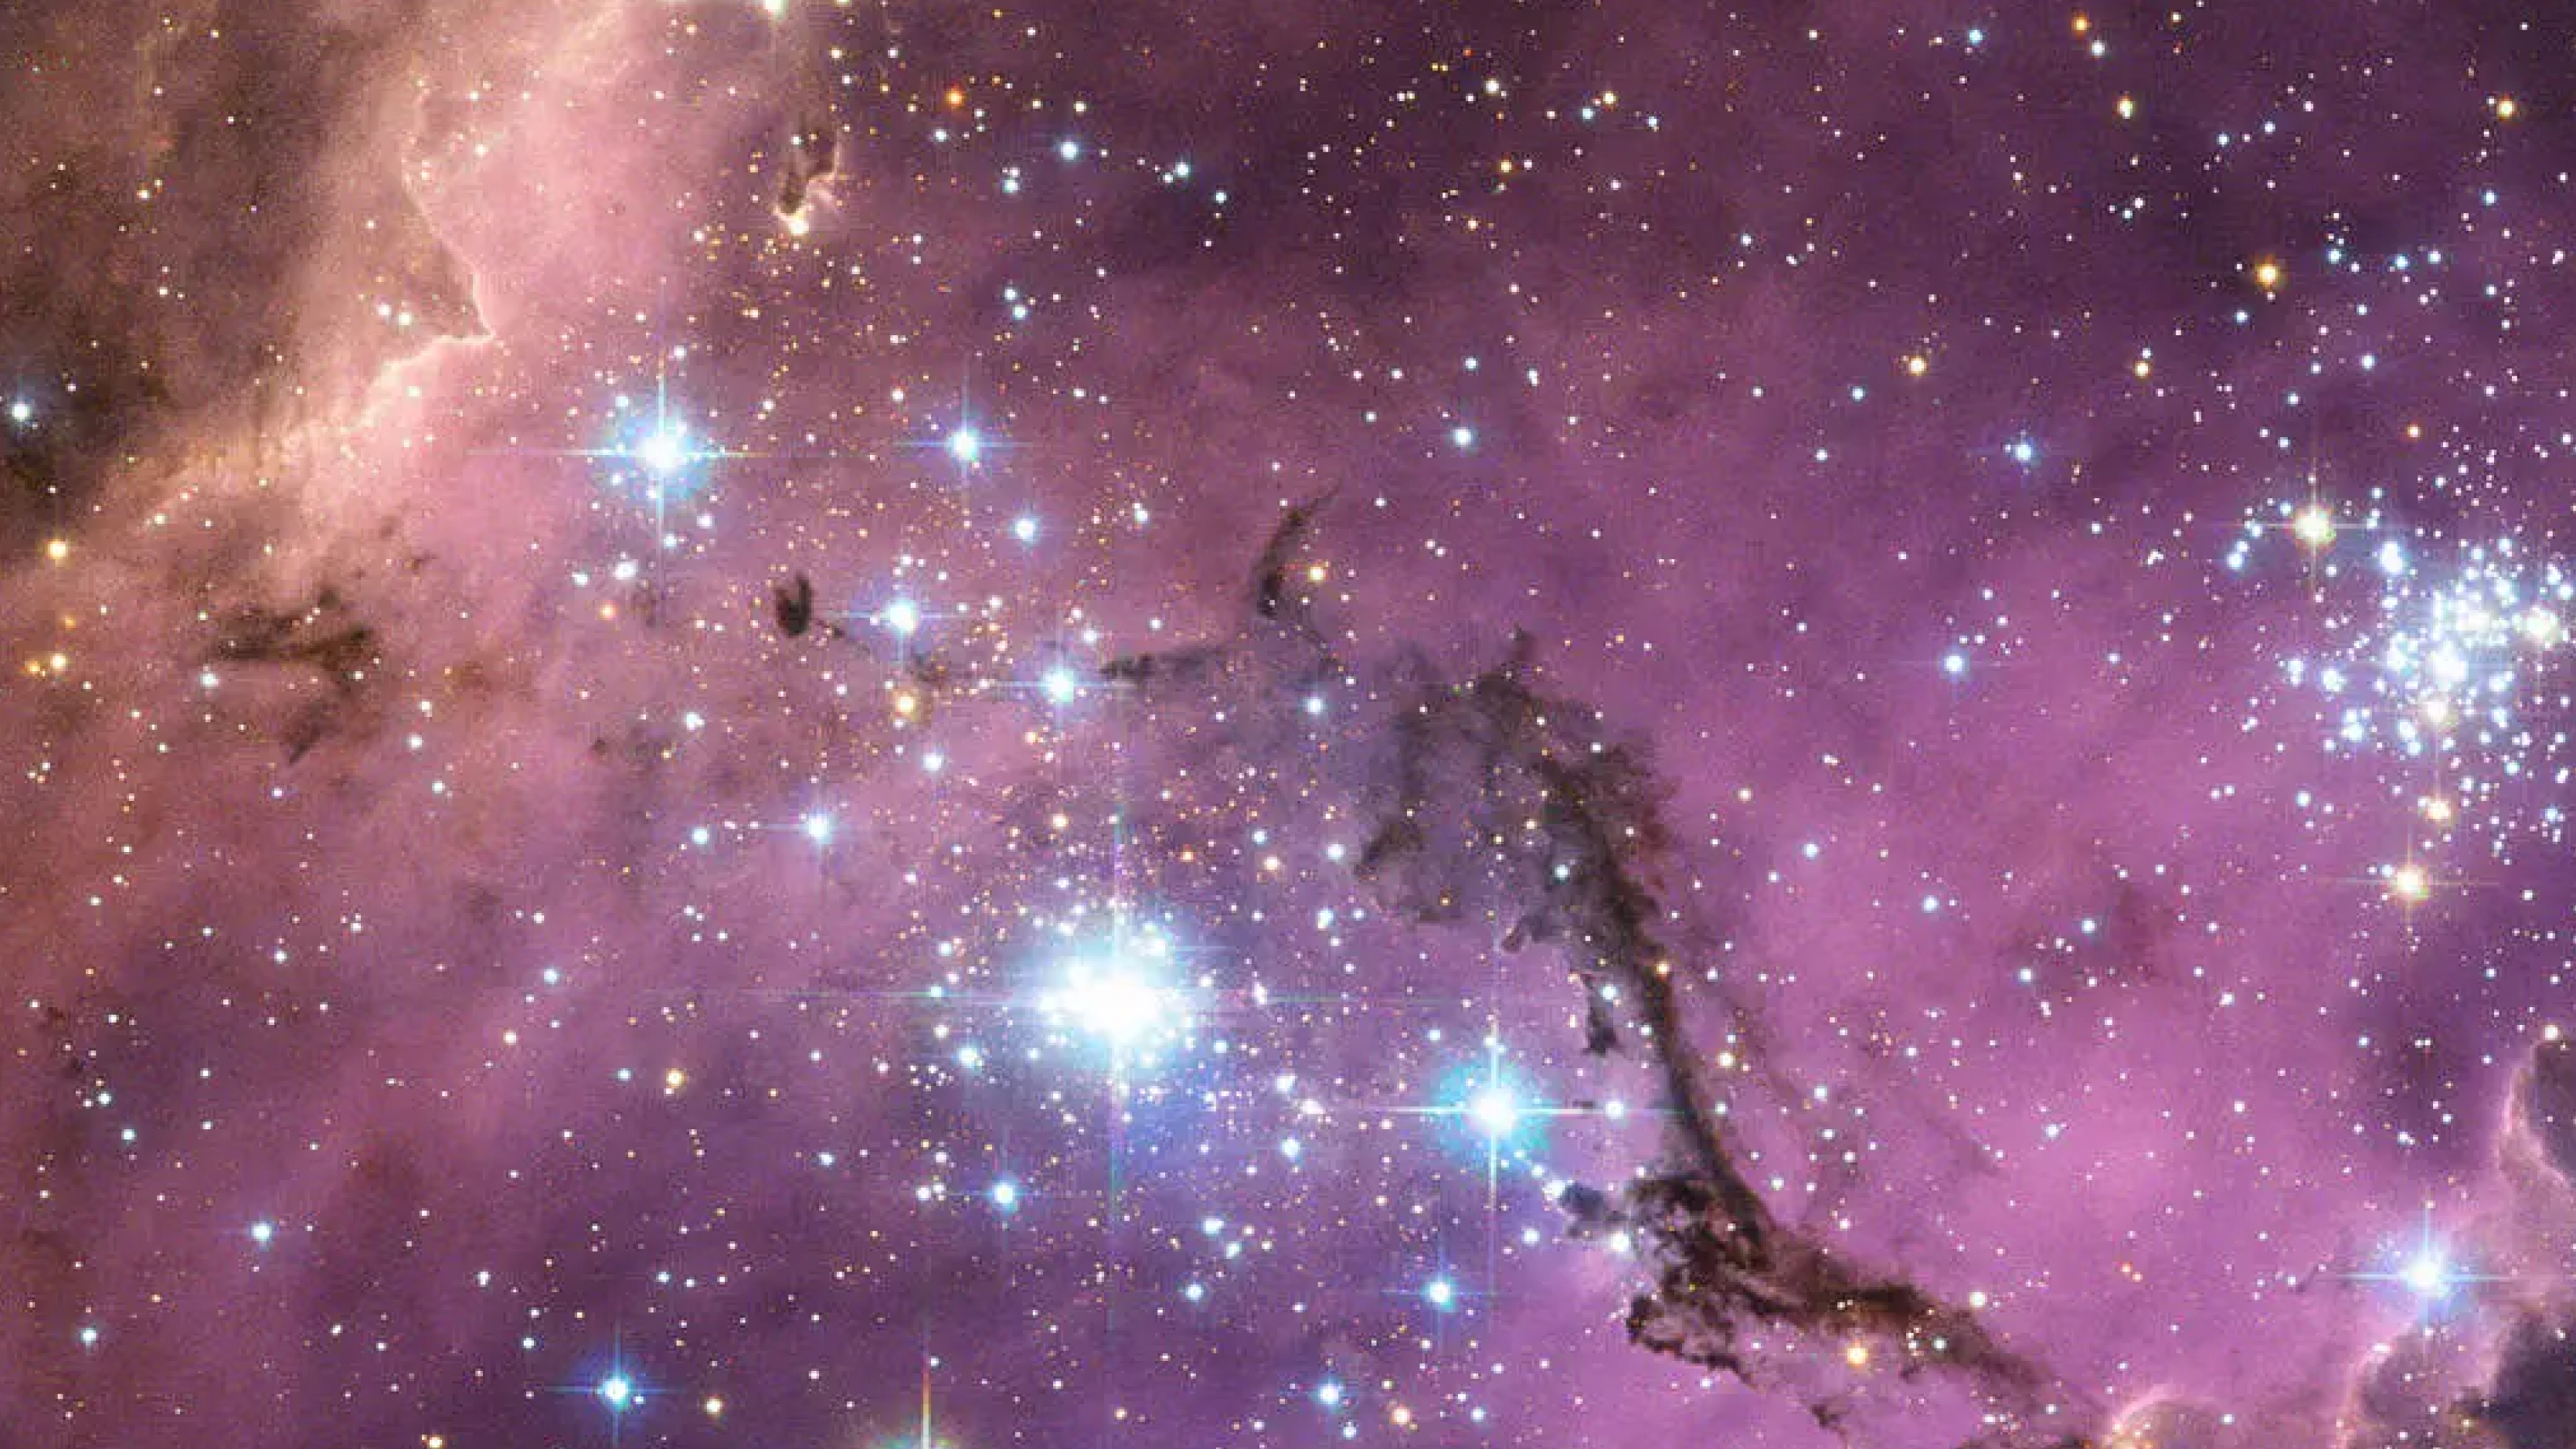
Nearly 200,000 light-years from Earth, the Large Magellanic Cloud is a satellite galaxy of the Milky Way. Vast clouds of gas within it slowly collapse to form new stars. In turn, these light up the gas clouds in a riot of colors, visible in this image from the Hubble Space Telescope. Credit: NASA | › Full image and caption
Scientists hope to use the information collected by GUSTO to develop models of the Milky Way and Large Magellanic Cloud. Studying these two galaxies allows scientists to observe more details and make more accurate models. Those models can then be used for comparing and studying more distant galaxies that are harder to observe.
Why Fly on a Balloon?
Unlike most NASA missions, GUSTO won’t launch on a rocket. It will be carried to approximately 120,000 feet (36.5 kilometers) above Antarctica using what’s known as a Long Duration Balloon, or LDB.
Balloon missions provide a number of advantages to scientists conducting research. They are more affordable than missions that go to space and require less time to develop. They also offer a way to test new scientific instruments and technologies before they are used in space. For these reasons, balloons have become a popular way for university students to gain experience building and testing science instruments.
Explore how balloons are being used for Earth and space science in this video from the Johns Hopkins Applied Physics Laboratory, which is providing the mission operations for GUSTO and the balloon gondola where the mission's instruments will be mounted. | Watch on YouTube
GUSTO's use of the Long Duration Balloon provided by NASA’s Balloon Science Program offers several advantages over other types of scientific balloons. Conventional scientific balloons stay aloft for a few hours or a few days and rely on the balloon maintaining a line-of-sight to send and receive data. Long Duration Balloons use satellites for sending data and receiving commands and can stay afloat for a few weeks to a couple of months.
Made with a thin, strong, plastic film called polyethylene, LDBs are partially inflated with helium. As the balloon rises, the surrounding air pressure decreases, allowing the gas inside the balloon to expand, increasing the volume and pressure of the balloon. When fully expanded, the balloon has a volume of around 40 million cubic feet (1.1 million cubic meters). That’s big enough to fit an entire football stadium inside.
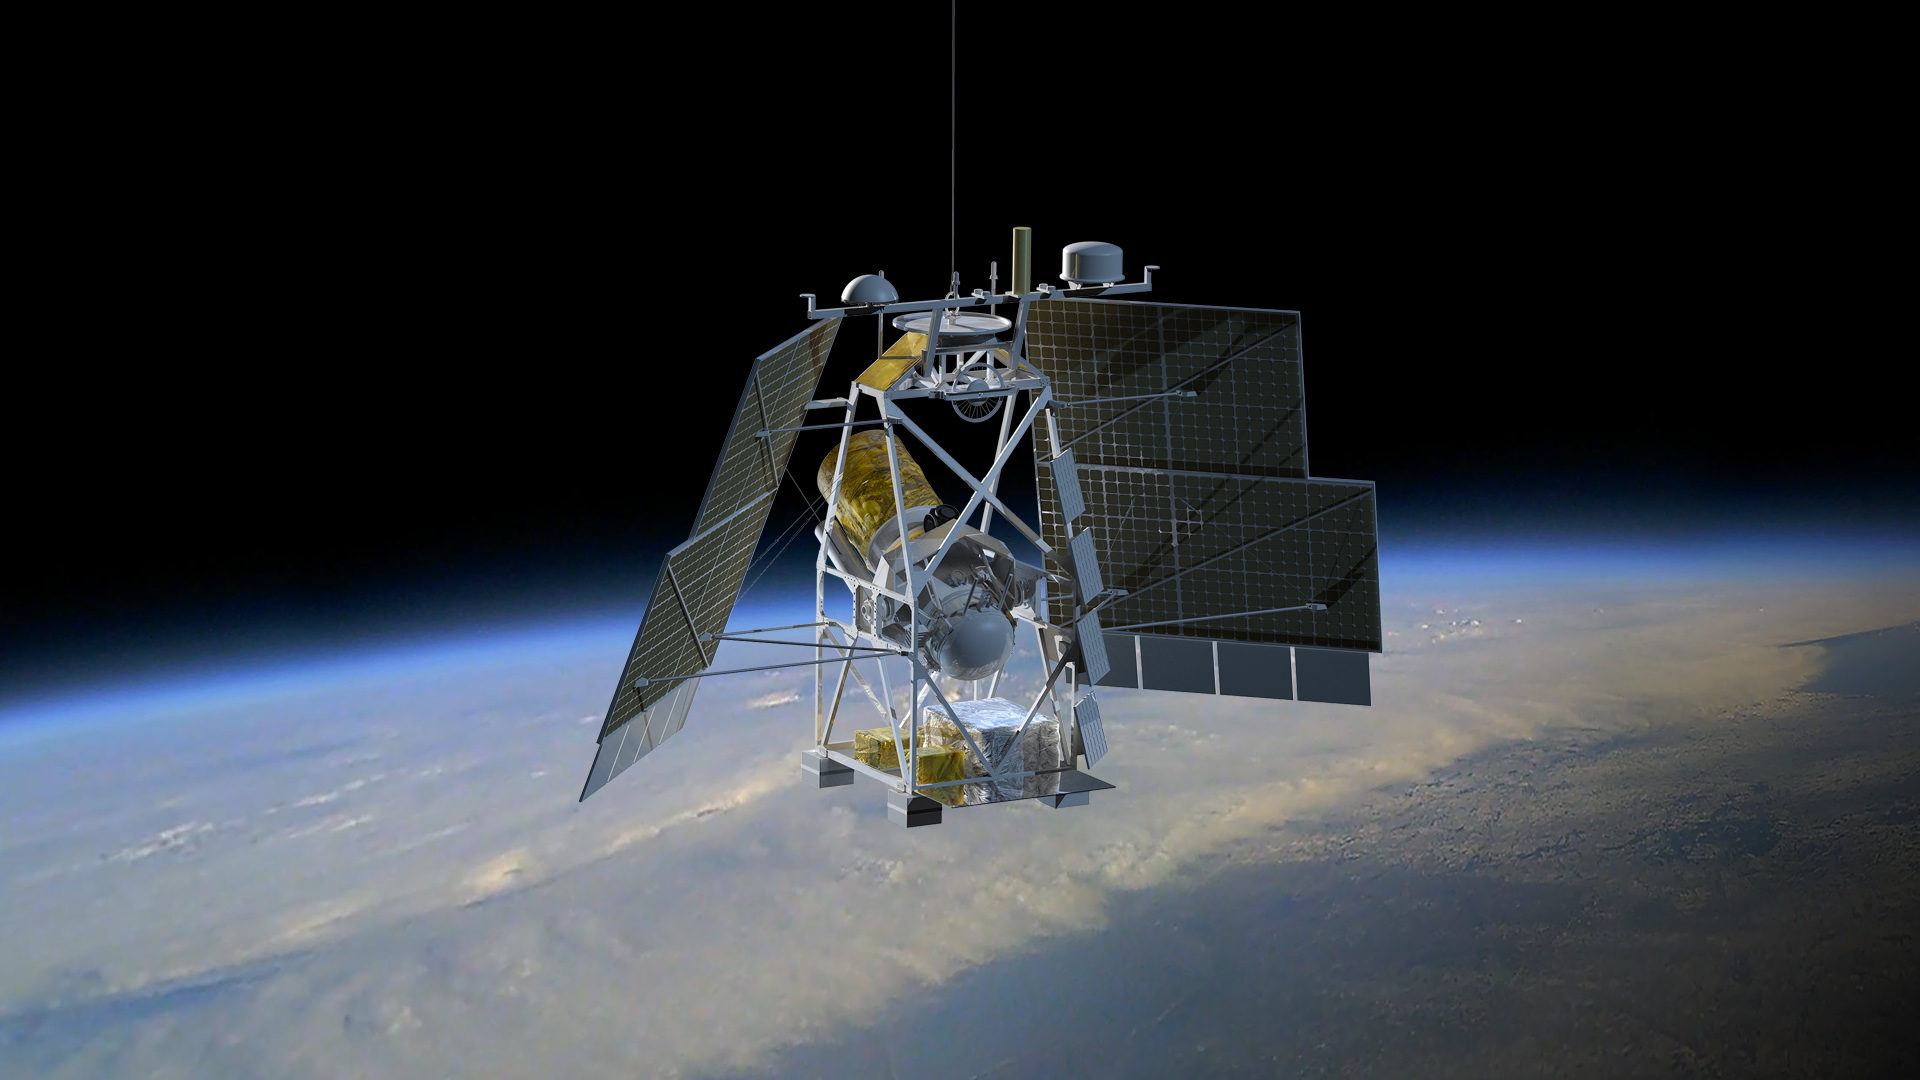
GUSTO will be attached to a balloon gondola like the one depicted in this artist's rendering. | + Expand image
The telescope itself will be attached to a platform known as a gondola, which is home to several components that make the mission possible. The multi-axis control system will keep the platform stable during flight, allowing for precisely pointing GUSTO’s 35-inch (90-centimeter) diameter telescope in the right direction. Cryocoolers and liquid helium will keep the telescope’s scientific instruments at the necessary low temperature of -452°F (4° Kelvin). And the gondola will house a radio system that allows operators on the surface to control the balloon and telescope. All these systems will be powered by lithium-ion batteries charged during flight by a set of solar arrays.
Location is Everything
GUSTO is designed to measure terahertz wavelengths (in the far-infrared portion of the electromagnetic spectrum), a range of energy that is easily absorbed by water vapor. However, the observatory's altitude will put it in the upper half of the stratosphere and above 99% of the water vapor in the atmosphere. This makes it an ideal location for the mission to make its measurements and avoid factors that might otherwise obstruct its view.

GUSTO will make its observations from the upper half of the stratosphere, which offers several benefits over observing from lower in the atmosphere or from the ground. Credit: NASA | › Explore the interactive graphic
The stratosphere offers another advantage for GUSTO. This layer of the atmosphere warms as altitude increases, making the top of the stratosphere warmer than the bottom. The colder air at the bottom and warmer air at the top prevents mixing and air turbulence, making the air very stable and providing a great place to observe space. You may have noticed this stability if you’ve seen a flat-topped anvil-shaped storm cloud. That flat top is the cloud reaching the bottom of the stratosphere, where the stable air prevents the cloud from mixing upward.
But why fly GUSTO above Antarctica? Even though balloons can be launched from all over the planet, the 24 hours of sunlight per day provided by the Antarctic summer make the south polar region an ideal launch location for a solar-powered mission like GUSTO. But more important is a weather phenomenon known as an anticyclone. This weather system is an upper-atmosphere counter-clockwise wind flow that circles the South Pole about every two weeks. The Antarctic anticyclone allows for long balloon flights of missions that can be recovered and potentially reflown.
Preparing for Liftoff
To launch a balloon mission in Antarctica, weather conditions have to be just right. The anticyclone typically forms in mid-December but can arrive a little earlier or a little later. Even with the anticyclone started, winds on the ground and in the first few hundred feet of the atmosphere need to be under six knots (seven miles per hour) for GUSTO to launch. A NASA meteorologist provides daily updates on the cyclone and the ground.
Once weather conditions are good and the balloon is launched, it will circle Antarctica about once every 14 days with the wind. The anticyclone typically lasts one to two months. Because GUSTO may be in the air for more than two months, it’s possible that the mission will continue after the anticyclone ends, causing the balloon to drift northward as winter progresses.
Bring GUSTO Into the Classroom
The GUSTO mission is a great opportunity to engage students with hands-on learning opportunities. Students can build a planetary exploration balloon and model how interstellar dust forms into planets. Explore these lessons and resources to get students excited about the STEM involved in the mission.
Resources for Educators
-
 Lesson
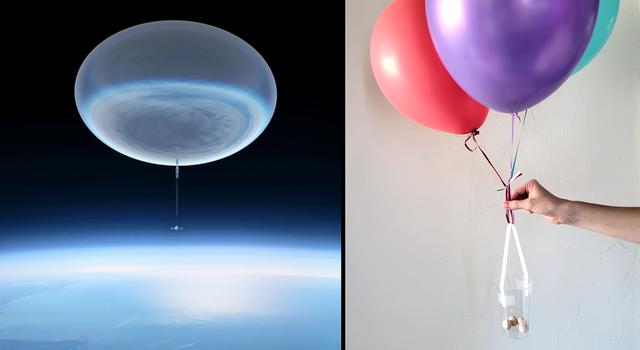
Make a Planetary Exploration Balloon
In this engineering challenge, students must stay within design limitations while creating a balloon and gondola system that can descend or ascend at a given rate or maintain its altitude.
Subject Science
Grades 3-12
Time Less than 30 mins
-
 Lesson
The Science of Color
Quickly and easily model how colors reflect, absorb, and interact with each other in the classroom or online using your computer’s camera.
Subject Science
Grades 2-8
Time 30-60 mins
-
 Interactive
Star Formation: Eagle Nebula
View the Eagle Nebula in different wavelengths to see how new details emerge.
Subject Science
Resources for Students
- Project
Make a Planetary Exploration Balloon
Find out how NASA uses balloons to explore Earth and space and then take on a challenge to design your own balloon explorer inspired by what you've learned!
Subject Science
Grades 3-12
Time 30-60 mins
-
 Article
What Is a Galaxy?
Learn what galaxies are made of in this article from NASA Space Place.
-
 Article
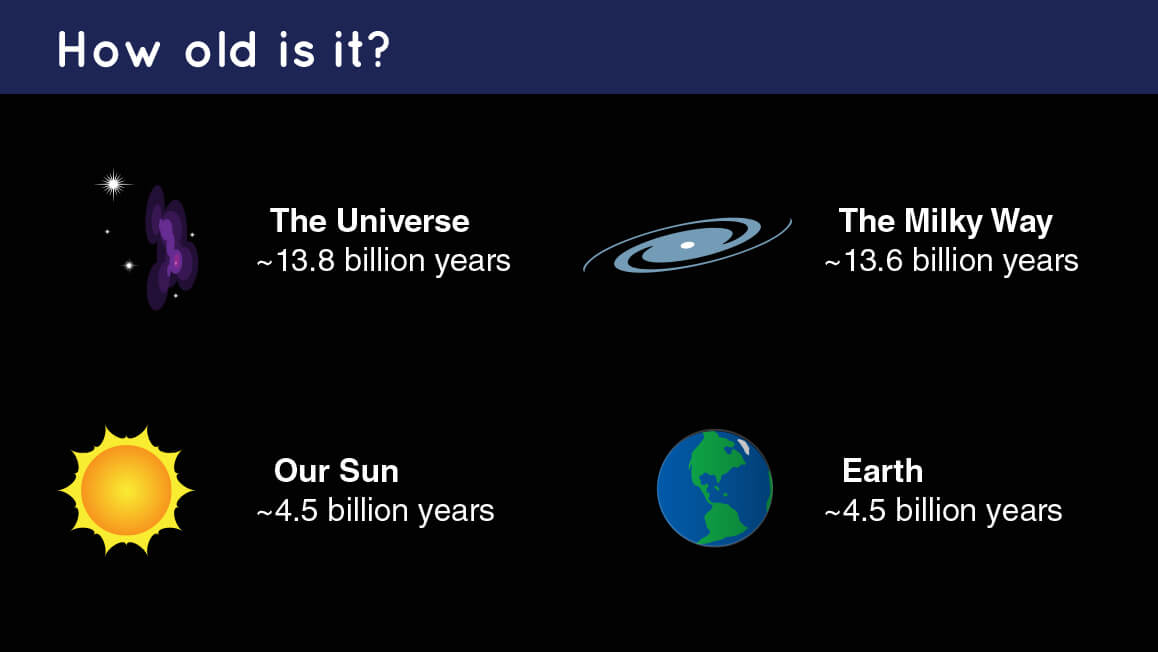
How Old Are Galaxies?
Get the answer in this article from NASA Space Place.
-
 Interactive
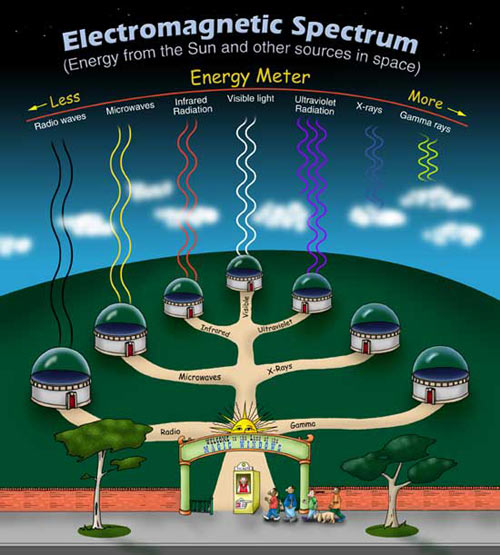
Explore the Electromagnetic Spectrum
Click through this interactive from NASA Space Place all about the electromagnetic spectrum.
NASA's Universe of Learning materials are based upon work supported by NASA under award number NNX16AC65A to the Space Telescope Science Institute, working in partnership with Caltech/IPAC, Center for Astrophysics | Harvard & Smithsonian, and the Jet Propulsion Laboratory.
TAGS: GUSTO, Astronomy, Astrophysics, Science, Teaching, Learning, K-12, Classroom, Teachable Moments, Universe of Learning, Balloon Mission, Missions
Edu News | August 17, 2023
Spend the School Year With NASA-JPL

Make educational connections to NASA and JPL happenings all year long with this calendar of upcoming events and links to educational resources you can use to explore STEM with us throughout the 2023-2024 school year.
August
All Month – Go Back to School With Us
The start of the school year is a great time to explore all of the resources we have on offer for educators, parents, and K-12 students. These include everything from classroom activities to DIY student projects to video tutorials to expert talks to our Teachable Moments series, which offers education-focused explainers of the latest NASA news.
There's something for every day of the school year, and you can find it all in one place on our Back to School event page. You can also sign up to receive monthly updates about new and featured content as well as upcoming events in your inbox with the JPL Education newsletter.
Learning Resources
- Public Event
Back to School With NASA-JPL Education
All the resources you'll need for a stellar school year from classroom lessons to student activities, challenges, and more!
-
 Sign Up
JPL Newsletter
Sign up to receive the latest STEM education resources, events, and news for teachers, students, and parents from the education team at JPL.
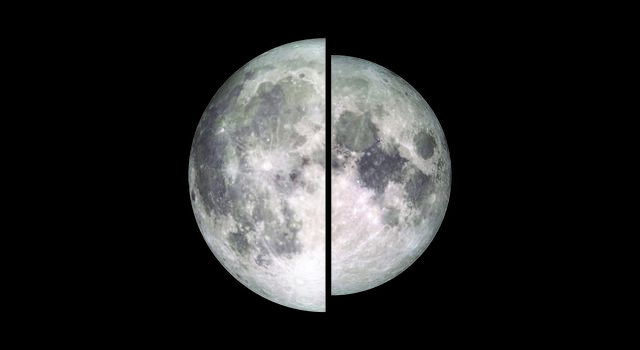
August 30 – See Supermoons on Parade
Skygazers will have plenty to moon over in August as the second of two supermoons this month graces the sky on August 30.
Make the event a Teachable Moment by dispelling common misconceptions about supermoons and digging into the real science behind the phenomena. Get students acting out moon phases, then have them apply what they've learned to make a Moon phases calendar and calculator. Plus, explore even more classroom activities and DIY projects all about our Moon.
Learning Resources
-
 Teachable Moments
What’s a Supermoon and Just How Super Is It?
Here’s what you can really expect to see during a supermoon. You don’t have to take our word for it. Get students investigating themselves.
-
 Collection
Moon Lessons for Educators
Teach students about the Moon with this collection of standards-aligned activities inspired by real NASA missions and science.
- Collection
Moon Activities for Students
Learn all about the Moon with these projects, slideshows, and videos for students.
September
September 24 – Follow Along as Asteroid Samples Arrive on Earth
Samples collected from the surface of an asteroid parachuted down to Earth on September 24, landing about 70 miles west of Salt Lake City. The samples were collected by the OSIRIS-REx spacecraft, which gathered the material during a daring descent on asteroid Bennu in 2018. The mission, which marks the first time the U.S. has collected samples from an asteroid, will give scientists an unparalleled, up-close look at remnants from our early solar system.
Follow along with the mission by having students do some of the same math as OSIRIS-REx mission planners. Or, have them do their own asteroid-related experiments. It's also a great opportunity to make connections to another NASA sample-return mission.
Learning Resources
- Collection
Asteroids Lessons for Educators
Explore a collection of standards-aligned lessons all about asteroids and craters.
-
 Collection
Asteroids Activities for Students
Explore projects, videos, slideshows, and games for students all about asteroids.
October
October 12 – Join NASA for the Psyche Launch
Did you know we can explore asteroids and other far away objects in the solar system to learn more about the interior of our own planet? That's one of the goals of NASA's Psyche mission, which is slated to launch on October 12 from NASA's Kennedy Space Center in Florida. The mission is designed to explore an asteroid – also named Psyche – that may be the remnant of a planet's core.
The Psyche spacecraft is one of just a handful of NASA missions throughout history that have used electric propulsion rather than a chemical engine, which means it's also a great opportunity to make connections to real-world examples of motion and forces. Get a primer on all the engineering and science behind the mission from our Teachable Moments series, then explore related lessons and projects.
Learning Resources
-
 Article
Teachable Moments: Asteroid Mission Aims to Explore Mysteries of Earth's Core
Explore how NASA's Psyche mission aims to help scientists answer questions about Earth and the formation of our solar system.
-
 Collection
Psyche Lessons for Educators
Explore a collection of standards-aligned lessons related to NASA's Psyche mission.
- Collection
Psyche Activities for Students
Explore projects, videos, slideshows, and games for students all about asteroids.
October 14 – Catch the Annular Solar Eclipse
October 14 marks the start of another exciting double-feature for skygazers: an annular solar eclipse followed by a total solar eclipse just six months later. In both events, the Sun, Moon, and Earth will align, creating a spectacular sight in the sky. But during the annular solar eclipse on October 14, a ring of sunlight will remain visible around the Moon. This is due to differences in the relative distances between the Sun, Moon, and Earth during the eclipse. In any case, remember to never look directly at the Sun without proper protection, such as certified solar eclipse glasses.
Another fun way to view a solar eclipse is by making a pinhole camera. Students can even use their pinhole cameras to make solar art. Check out our Teachable Moments article for more info on where and when to watch the eclipse, plus a primer on the science of solar eclipses. And explore even more eclipse lessons and activities – including a math puzzler from our NASA Pi Day Challenge.
Learning Resources
- Teachable Moment
The Science of Solar Eclipses and How to Watch With NASA
Get ready for the annular solar eclipse on Oct. 14, 2023. Learn about the science behind solar eclipses, how to watch safely, and how to engage students in NASA science.
-
 Student Project
How to Make a Pinhole Camera
Learn how to make your very own pinhole camera to safely see a solar eclipse in action!
- Lesson
Model a Solar Eclipse
Students use simple materials to model a partial, annular, and total solar eclipse.
- Math Problem
Eclipsing Enigma: A ‘Pi in the Sky’ Math Challenge
In this illustrated math problem, students use pi to figure out how much of the Sun’s disk will be covered by the Moon during an eclipse and whether it’s a total or annular eclipse.
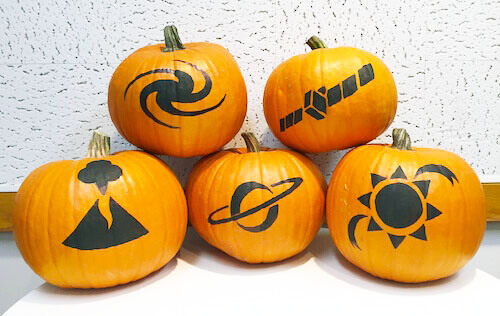
Oct. 31 – Dare Mighty Pumpkins
Every Halloween, during an annual contest held at JPL, our engineers join kids and families across the country in the hallowed tradition of pumpkin carving. But these aren't your average jack-o'-lanterns. JPL pumpkins from years past have included a simulated Moon landing, Mars-themed whack-a-mole, and an exploding pumpkin supernova. The event, which takes place during employees' lunch break, gives all-new credence to the Lab's unofficial motto, "Dare Mighty Things." And it's good timing because this Halloween is also JPL's 87th birthday.
Whether history or Halloween are your thing, we've got ways to make educational connections – including a DIY project that gets students daring mighty pumpkins, themselves.
Learning Resources
-
 Collection
Halloween Activities for Students
Explore student projects and slideshows that put a Halloween twist on STEM.
-
 For Kids
Halloween Activities and Articles for Kids
Explore Halloween activities from NASA's Space Place, including pumpkin stencils, planet masks, an a scary space slideshow.
-
 Articles
Teachable Moments: JPL History
Explore key moments in JPL history and how they connect to what students are learning now.
November
All Month – Explore STEM Careers
Take part in National Career Development Month in November by exploring STEM opportunities at NASA and JPL. Students can learn more about careers in STEM and hear directly from scientists and engineers working on NASA missions in our Teaching Space video series. Meanwhile, our news page has more about what it takes to be a NASA astronaut and what it's like to be a JPL intern. You can also explore a collection of stories about NASA people, Women at NASA, and Women at JPL to learn more about the work they do.
For students already in college and pursuing STEM degrees, it's never too soon to start exploring internship opportunities for the summer. The deadline for JPL summer internships is March 29, so refresh your resume and get your application started now. Learn how to stand out with this article on how to get an internship at JPL – which also includes advice for pre-college students.
Learning Resources
-
 Expert Talks
Teaching Space With NASA
Hear from experts and education specialists about the latest missions and science happening at NASA and get your questions answered.
-
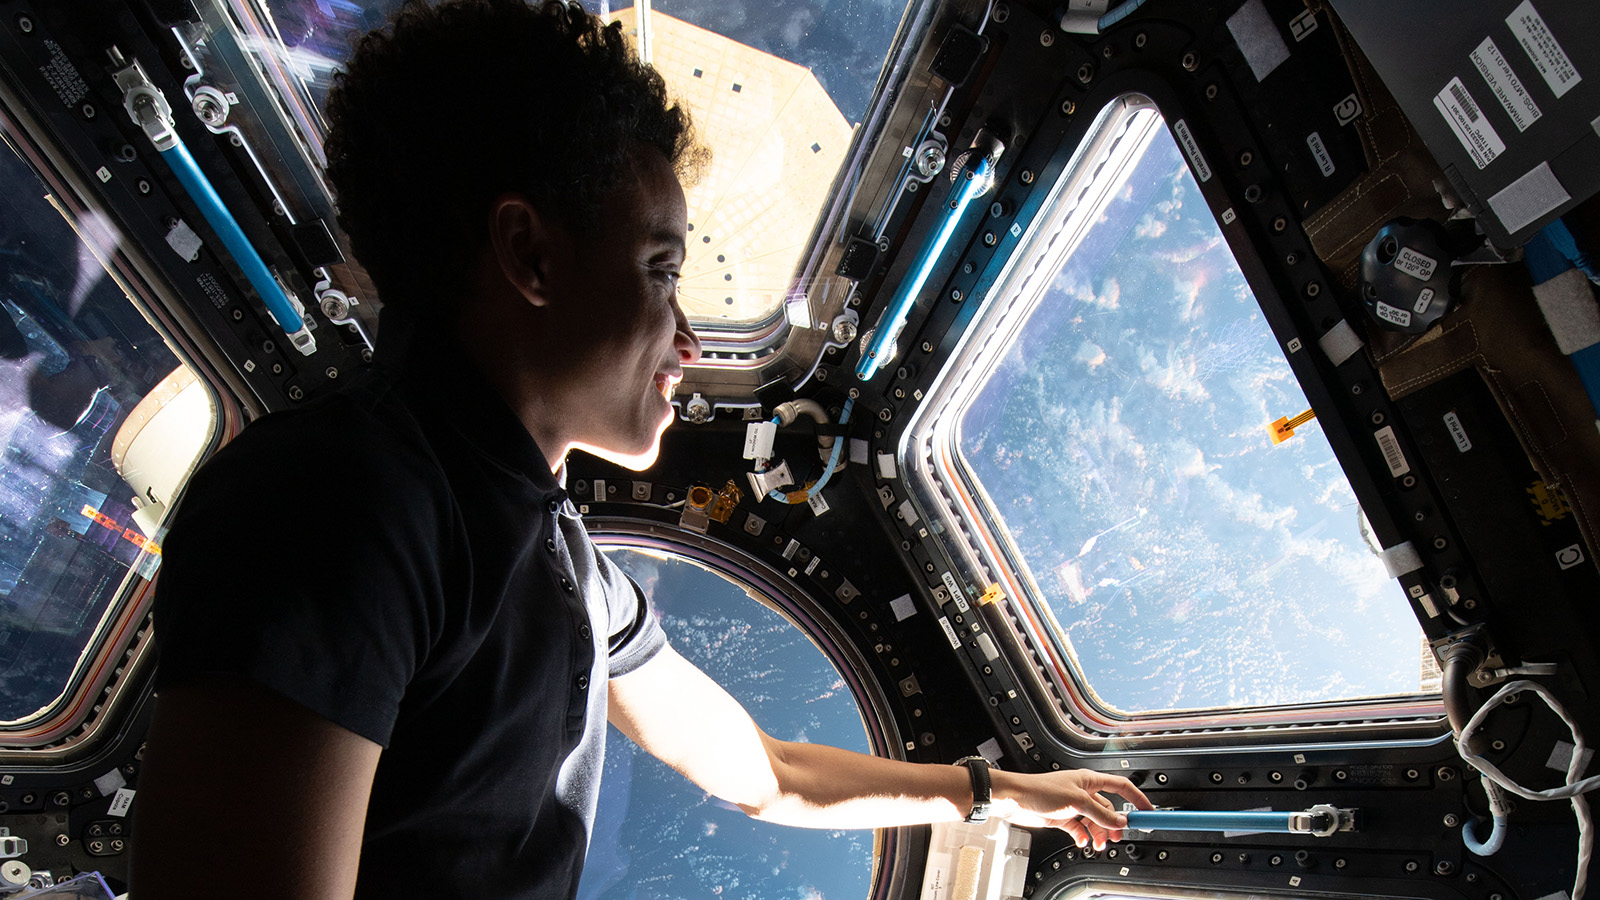 Articles
Career Guidance
Get advice from scientists, engineers and educators about what it takes to work in science, technology, engineering and mathematics fields and how to get a foot in the door.
- Articles
Meet JPL Interns
These interns are pushing the boundaries of space exploration and science at the leading center for robotic exploration of the solar system.
- Opportunities
Internships and Jobs at JPL and NASA
Discover exciting opportunities at the leading NASA center for robotic exploration of the solar system.
December
All Month – Send Your Name to Jupiter
Here's a gift idea that doesn't cost a thing: Send a loved one's name to Jupiter with NASA's Europa Clipper mission. December is the last month to add your name to a microchip that will be flown on the spacecraft along with a poem written by the U.S. Poet Laureate, Ada Limón. The Europa Clipper mission, which is scheduled to launch in October 2024, is designed to explore Jupiter's ice-covered ocean moon Europa – the newest frontier in our search for life beyond Earth. So don't miss the boat – or, in this case, spacecraft – on this exciting opportunity.
Explore activities students can do in class or over winter break to write their own space poetry and engage in hands-on activities and experiments related to the Europa Clipper mission.
Learning Resources
-
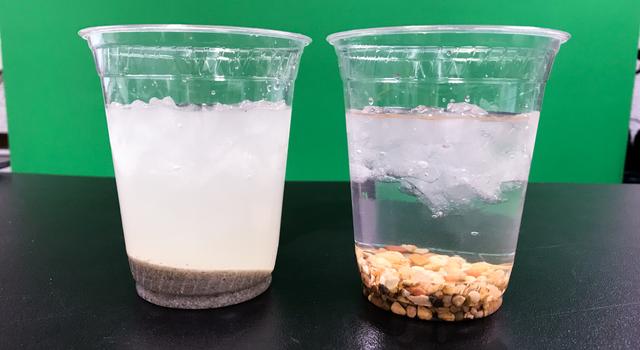 Collection
Europa Lessons for Educators
Explore classroom activities to bring the excitement of STEM and NASA's Europa Clipper mission to students.
- Collection
Europa Activities for Students
Learn all about Jupiter's moon Europa with these projects and videos for students.
-
 Public Event
Send Your Name to Jupiter
Have your name engraved on NASA's Europa Clipper spacecraft. Plus, explore more ways you can participate with the mission.
-
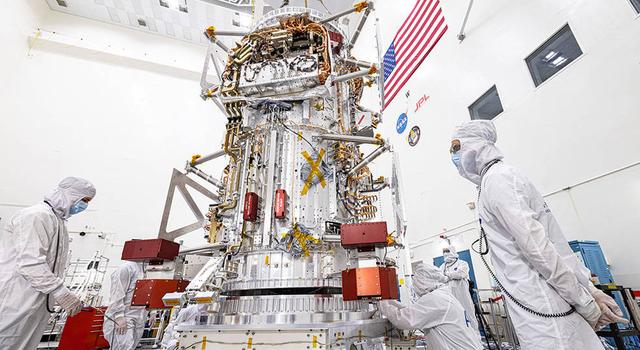 Live Stream
Watch Engineers Build Europa Clipper Live at JPL
Get a live view into the "cleanroom" at NASA's Jet Propulsion Laboratory, where engineers are building the Europa Clipper spacecraft.
All Month – Prepare for the Science Fair
Before you know it, it'll be science fair time. Avoid the stress of science fair prep by getting students organized and thinking about their projects before the winter recess. Start by watching our video series How to Do a Science Fair Project. A scientist and an engineer from JPL walk your students through all the steps they will need to create an original science fair project by observing the world around them and asking questions.
You can also explore our science fair starter pack of lessons and projects to get students generating ideas and thinking like scientists and engineers.
Learning Resources
-
 Video Series
How to Do a Science Fair Project
Learn all the ins and outs of crafting your very own science fair project.
-
 Collection
Science Fair Lessons for Educators
Teach students how to craft their own science and engineering fair project with these video tutorials and lessons featuring NASA missions and science.
-
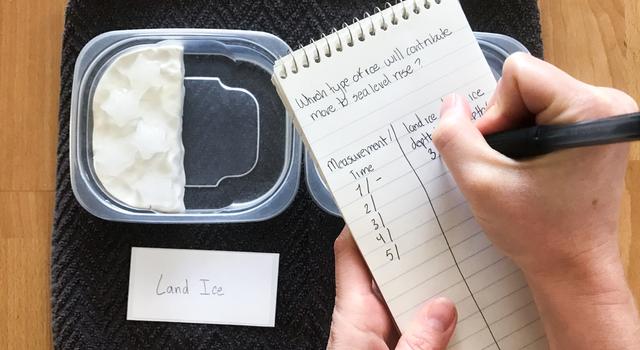 Collection
Science Fair Activities for Students
Learn how to design a science and engineering fair project and get inspired with our catalog of student projects featuring NASA missions and science.
January
January 4 - Take a Closer Look at Jupiter's 'Pizza Moon'
Everyone's favorite pizza moon is getting another series of close-ups from NASA's Juno mission. Now that Juno has completed its primary science goals, mission planners are tweaking the spacecraft's orbit to send it past some of Jupiter's most fascinating moons. Io – notable for the more than 150 active volcanoes that splotch its surface like a bubbling cheese pizza – is next on the docket with two planned flybys this school year. Keep an eye on the mission website for updates and images from the first flyby on Dec. 30, 2023 that you can use to engage students before the second flyby on Feb. 3, 2024.
While on the topic of Juno, which holds the title of the most distant solar-powered spacecraft, it's a great opportunity to segue into math lessons involving pi, exponents, and the inverse square law. Or, highlight another record-holder: Rosaly Lopes, the JPL scientist who discovered 71 active volcanoes on Io, for which she was given the 2006 Guiness World Record for her discovery of the most active volcanoes anywhere.
Learning Resources
-
 Collection
Juno Lessons for Educators
Explore classroom activities to bring the excitement of STEM and NASA's Juno mission to students.
- Collection
Juno Activities for Students
Learn all about NASA's Juno mission with these projects, slideshows, and videos for students.
-
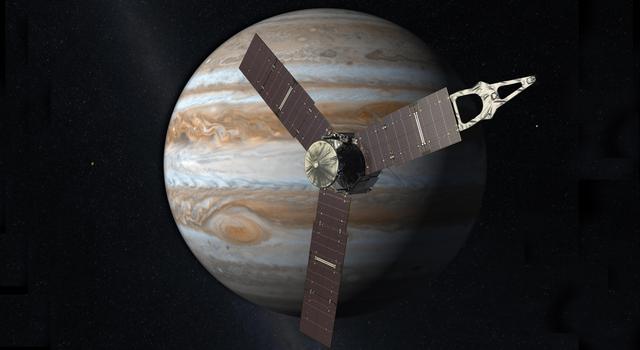 Teachable Moments
Cruising to Jupiter: A Powerful Math Lesson
Find out how NASA’s Juno mission at Jupiter earned the title of most distant solar-powered spacecraft and how it relates to exponents.
February
February 18 – Learn What's Next for Mars Exploration
February 18 marks three years since NASA's Perseverance rover touched down on Mars, sticking the landing on one of the riskiest Red Planet descents to date. While the rover is coring away on Mars, collecting a diverse array of scientifically intriguing samples, mission teams here are busy designing, developing, and testing various devices to bring those samples to Earth. While we've collected samples from other objects in the solar system before (see October's asteroid sample return), this would be the first time we've retrieved samples from another planet. It requires an ambitious plan executed by multiple teams that need to achieve a number of other firsts – including the first launch from another planet.
Get students following along with classroom activities, projects, and challenges that have them apply their coding and collaboration skills to designing their own Mars sample return missions.
Learning Resources
-
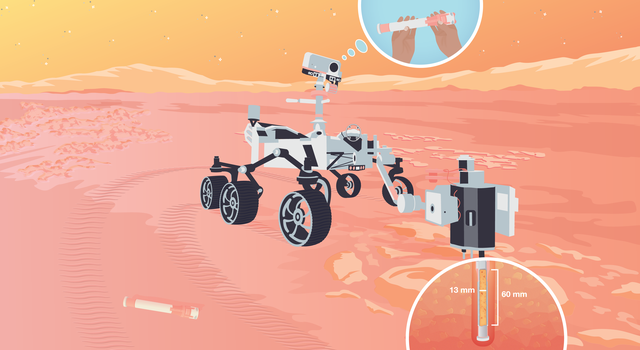 Collection
Mars Sample Return Lessons for Educators
Explore classroom activities to bring the excitement of STEM and NASA's Mars Sample Return mission to students.
-
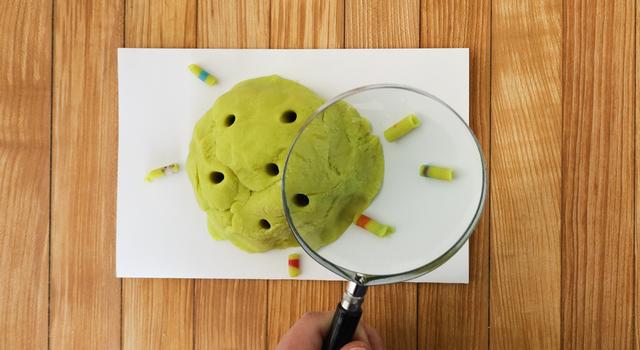 Collection
Mars Sample Return Activities for Students
Learn all about NASA's Mars Sample Return mission with these projects for students.
-
 Collection
Mission to Mars Student Challenge
Get K-12 students exploring Mars with NASA scientists, engineers, and the Perseverance rover as they learn all about STEM and design their very own mission to the Red Planet!
-
 Teachable Moments
NASA's Perseverance Rover Lands on Mars
Learn how, why, and what Perseverance will explore on Mars, plus find out about an exciting opportunity for you and your students to join in the adventure!
March
March 7-15 – Take the NASA Pi Day Challenge
There's more than pie to look forward to on March 14 as we'll be releasing an all-new set of Pi Day Challenge math problems involving NASA missions and science. Look for the latest problem set along with links to more resources and ways to celebrate Pi Day with us starting on March 7. You can get a sneak peek with the resources below, which work all year long, even without the slice of pie – although, we wouldn't blame you if you had one anyway.
Learning Resources
-
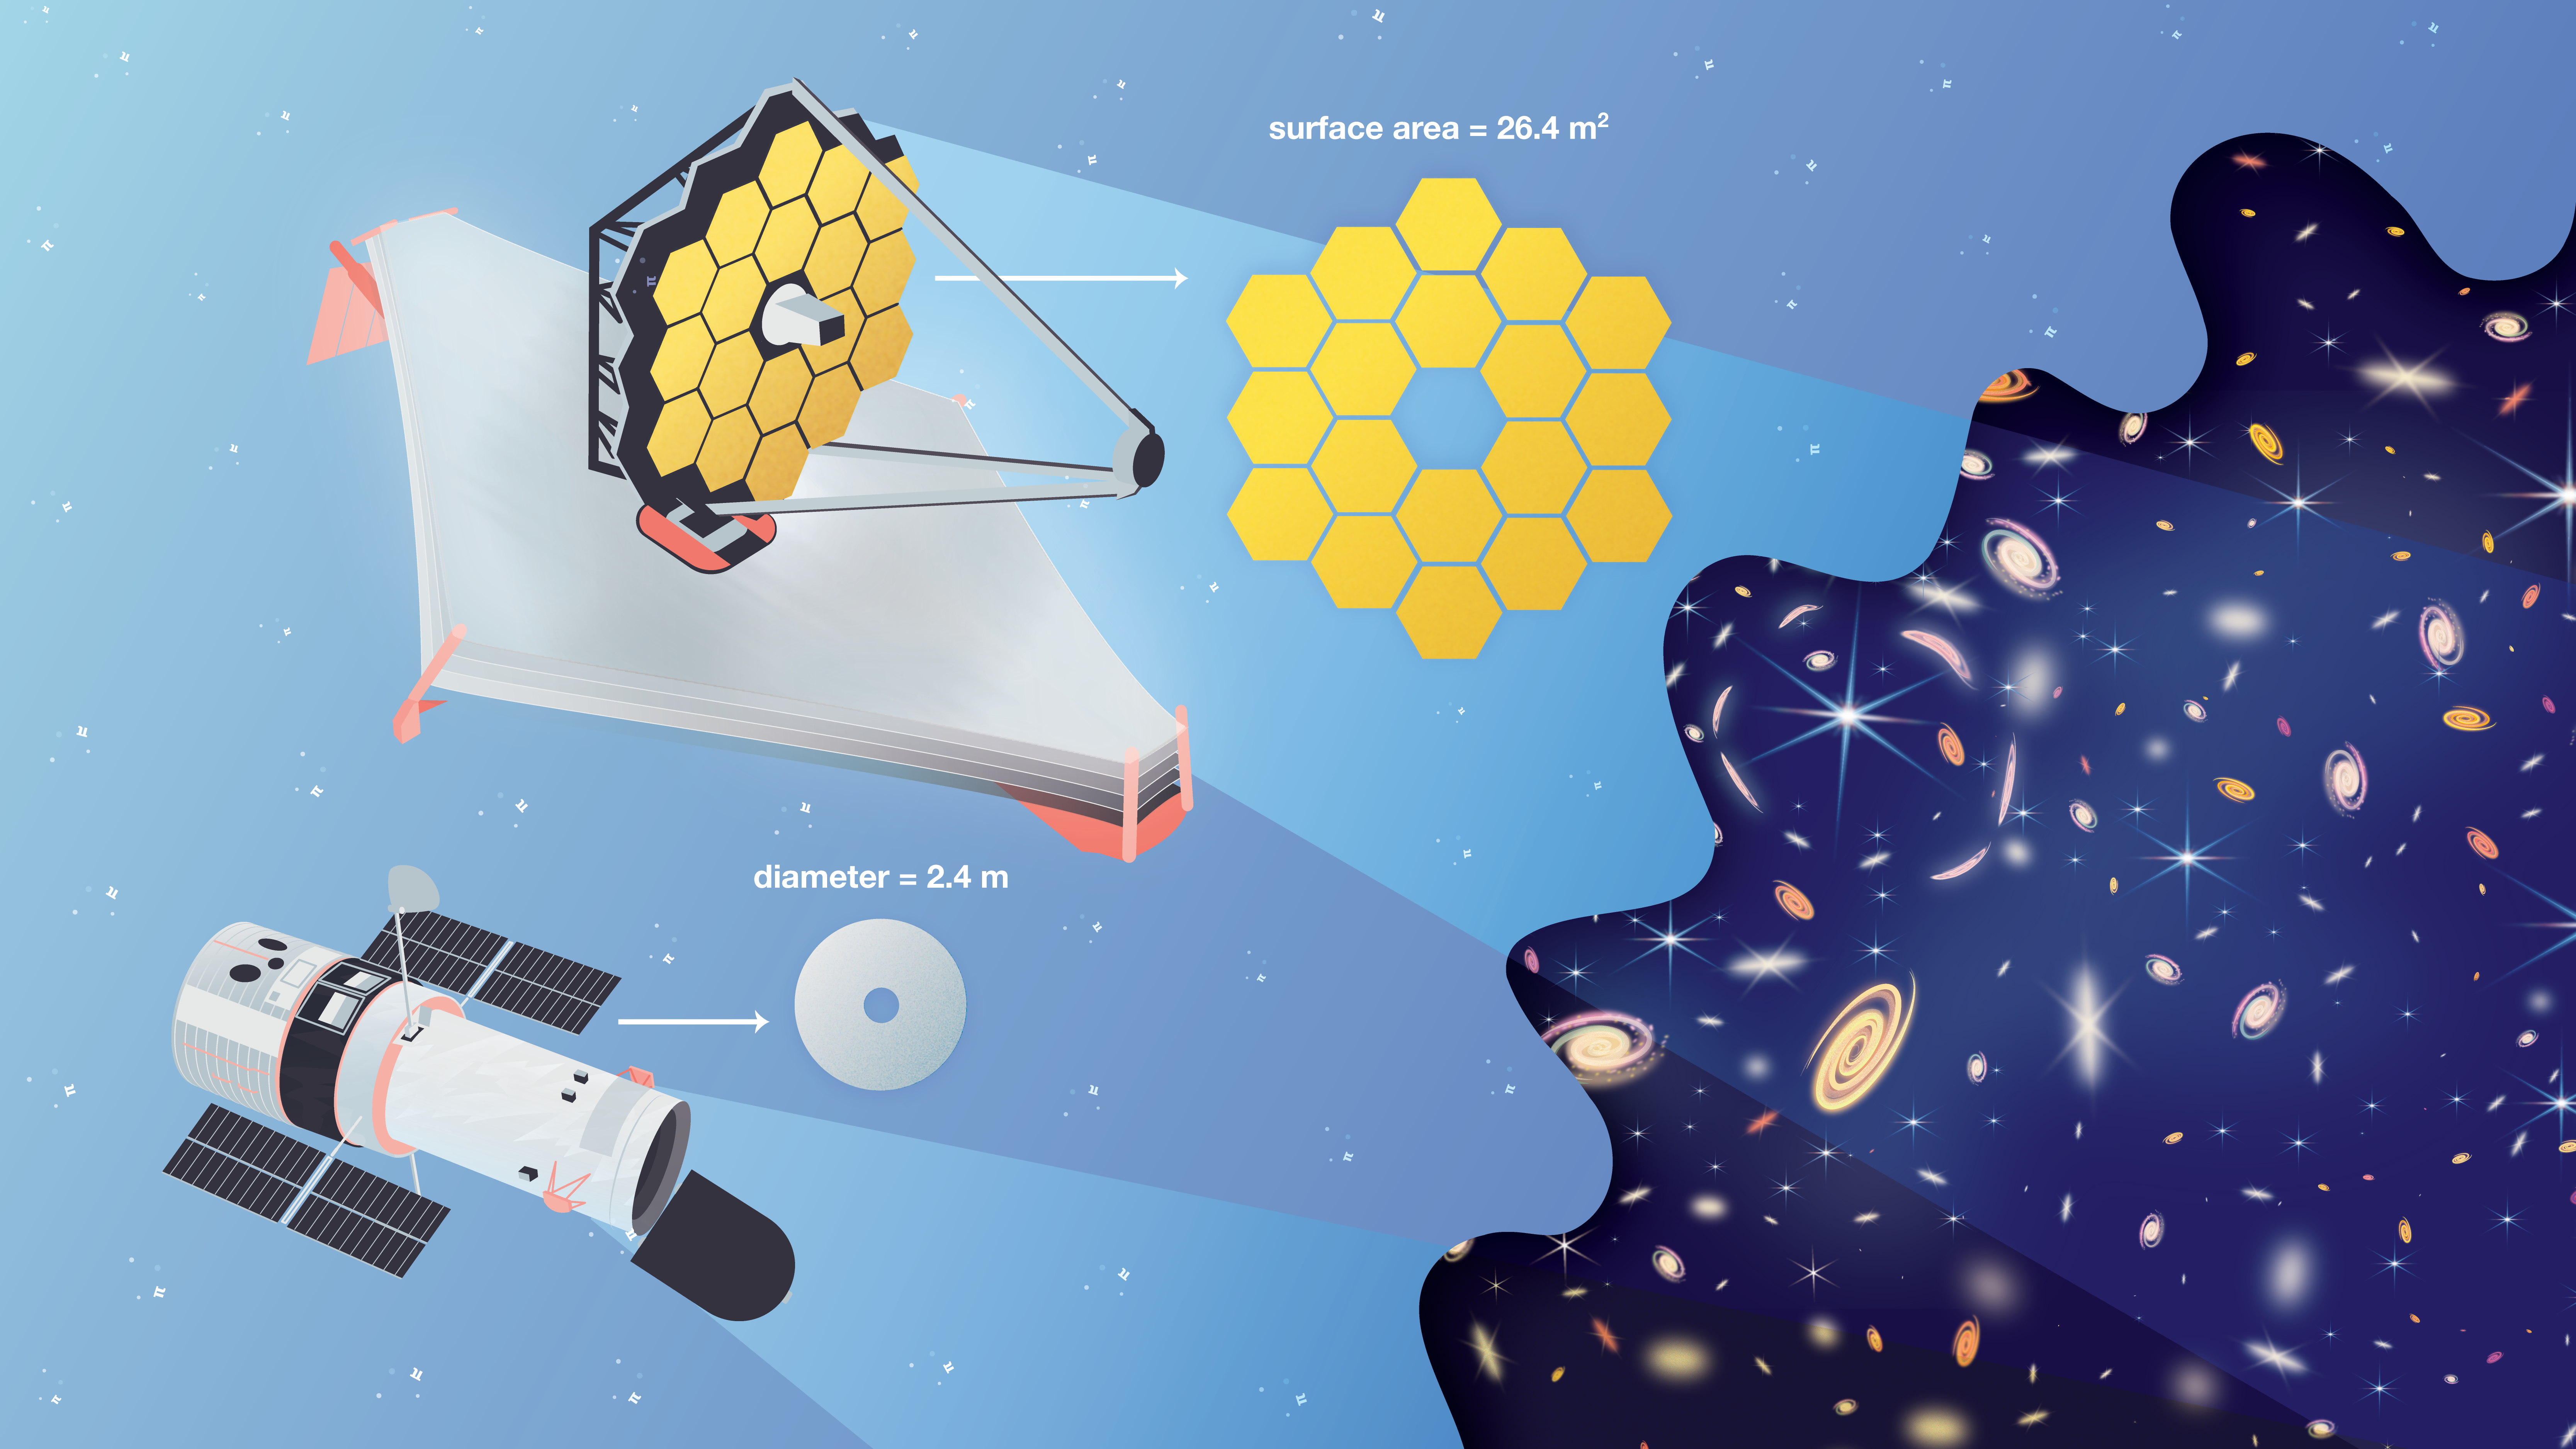 Collection
Pi in the Sky Lessons
Find everything you need to bring the NASA Pi Day Challenge into the classroom, including printable handouts of each illustrated math problem.
-
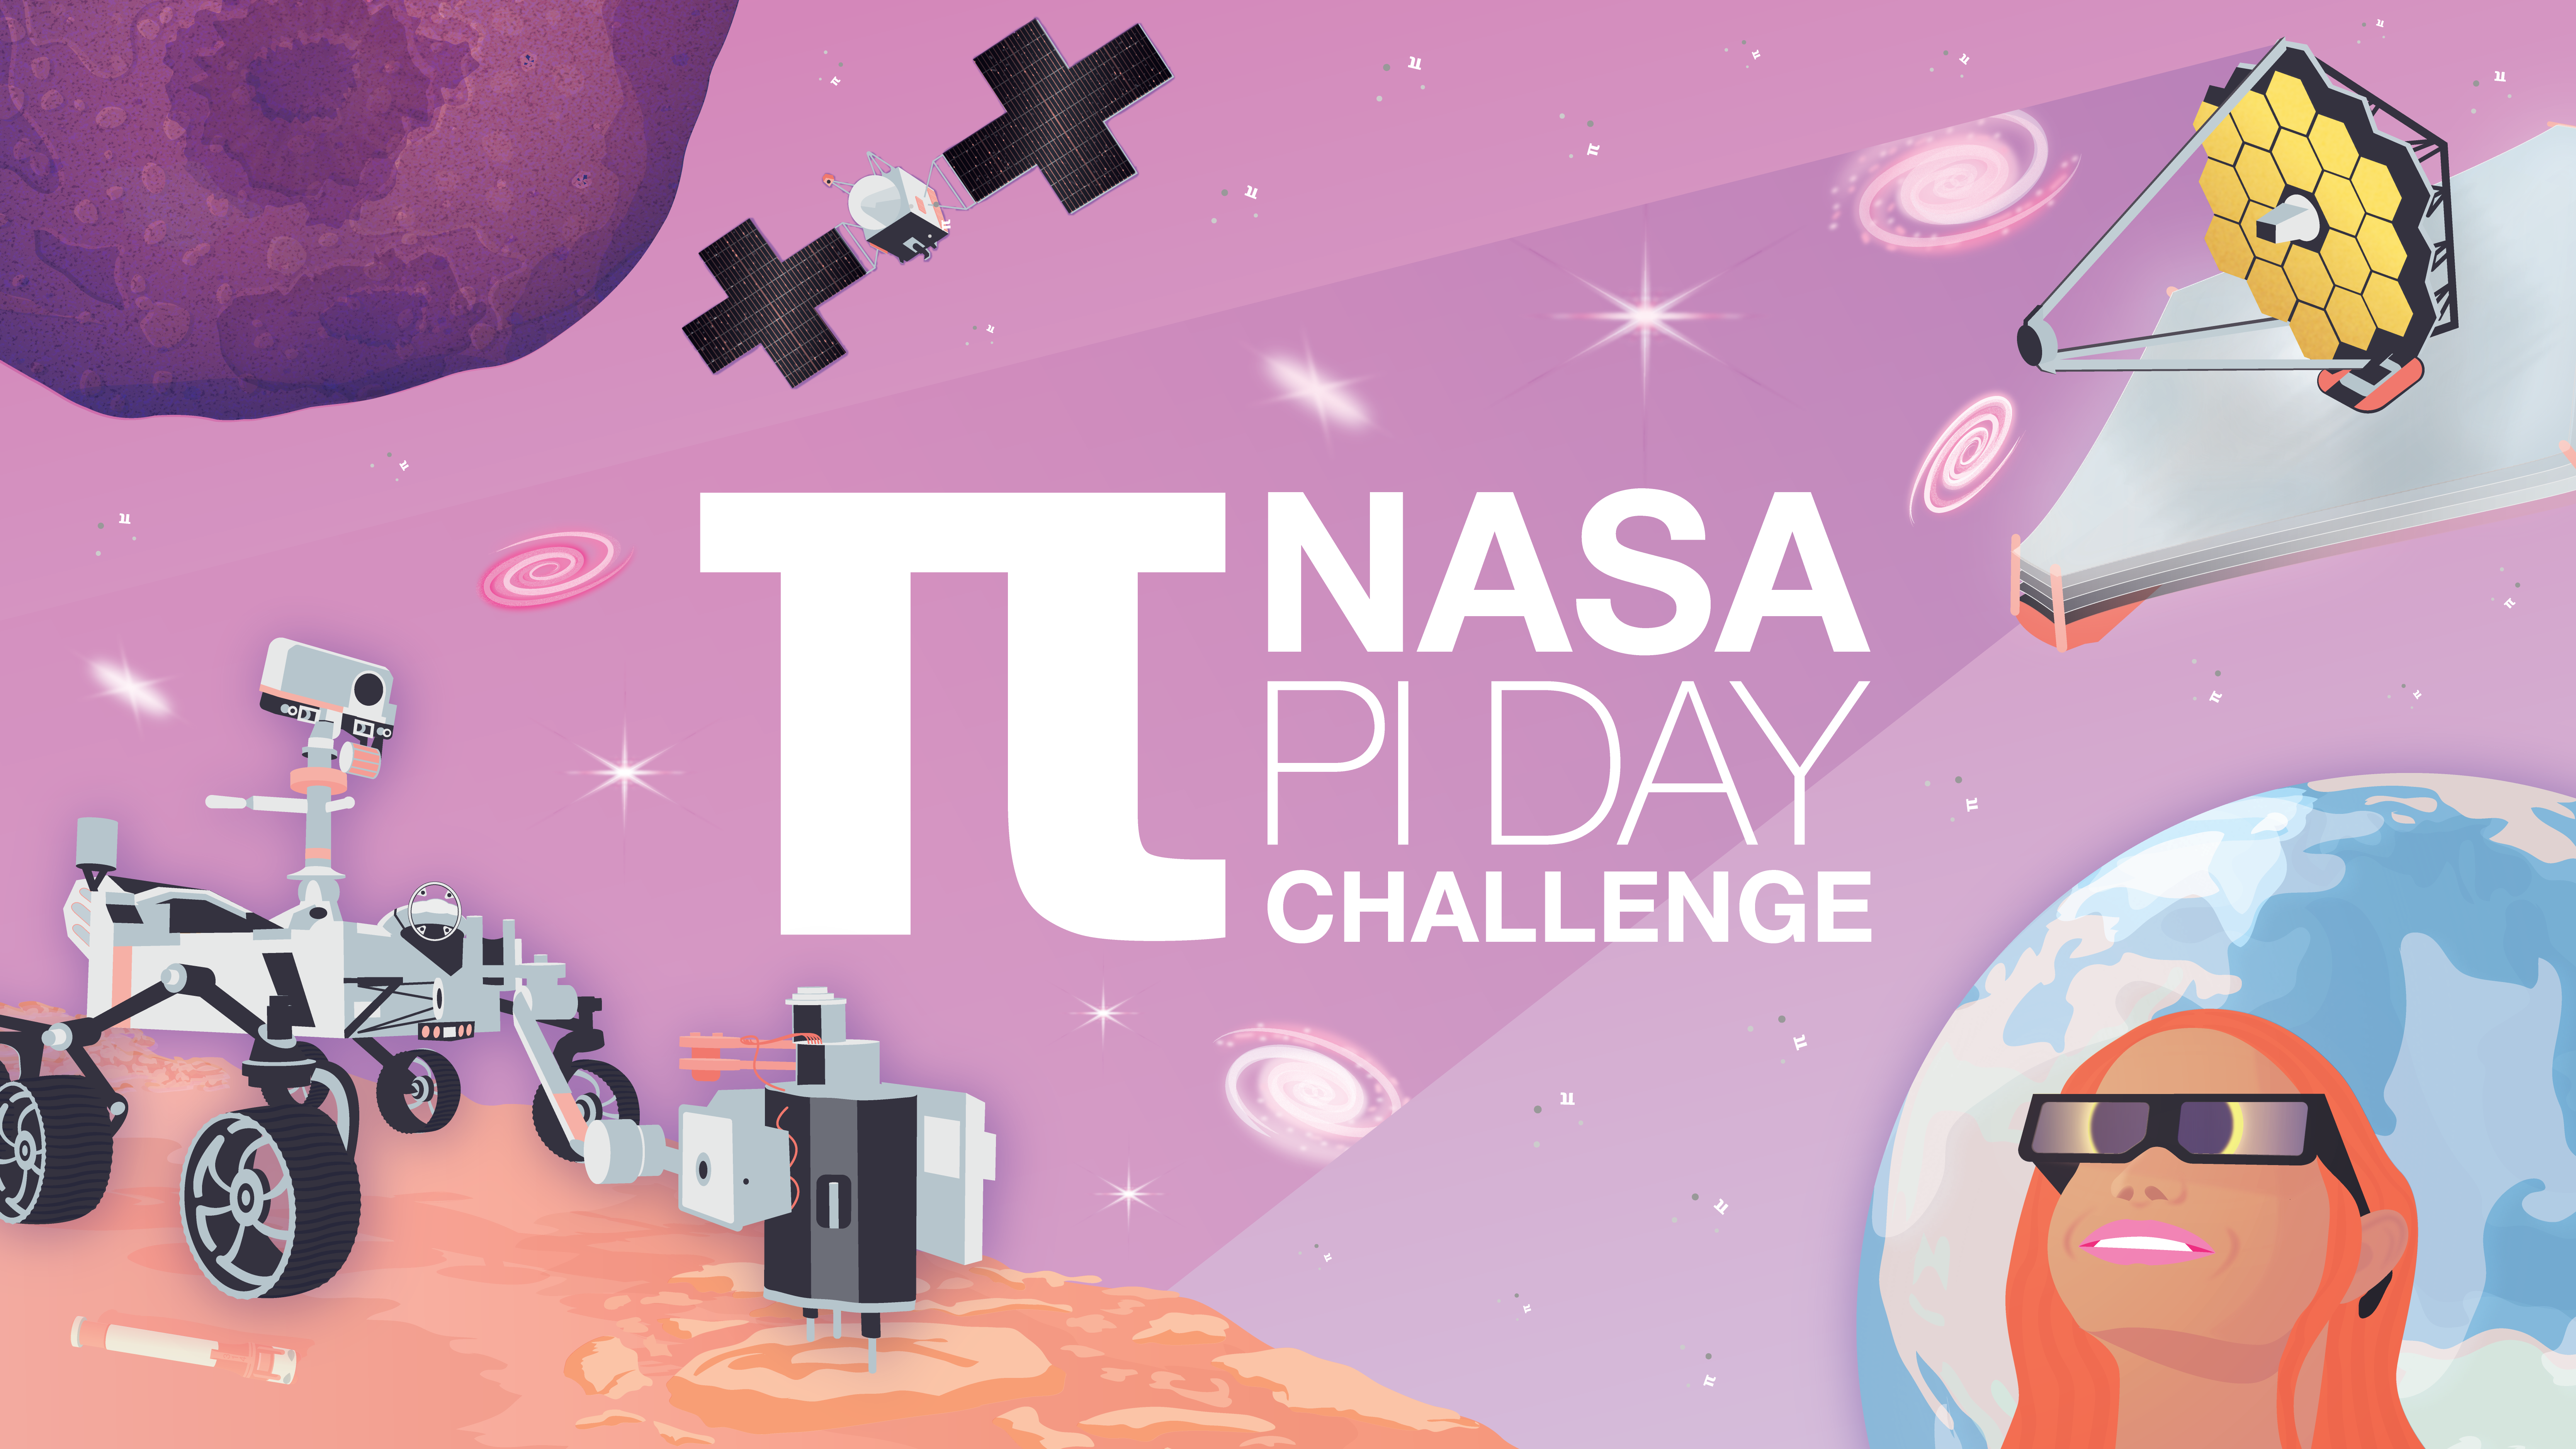 Student Project
NASA Pi Day Challenge
This collection of illustrated math problems gets students using pi like NASA scientists and engineers exploring Earth and space.
- Article
How Many Decimals of Pi Do We Really Need?
While you may have memorized more than 70,000 digits of pi, world record holders, a JPL engineer explains why you really only need a tiny fraction of that for most calculations.
- Article
18 Ways NASA Uses Pi
Whether it's sending spacecraft to other planets, driving rovers on Mars, finding out what planets are made of or how deep alien oceans are, pi takes us far at NASA. Find out how pi helps us explore space.
April
April 8 – Watch the Total Solar Eclipse
Time to get some solar eclipse glasses and dig out your pinhole cameras once again – this time for the headliner, a total solar eclipse on April 8. The eclipse will start in the South Pacific Ocean before passing over Mexico and following a diagonal path northeast over the U.S. and Canada. NASA is holding community events across the country where you can hear from speakers and participate in activities. Learn more on the agency's web page for all things solar eclipse.
Whether you're covering eclipse topics for the first time this school year or expanding on learning from October, this solar eclipse is a good time to get students exploring more about the science of eclipses. Start by looking at the five science experiments NASA has funded for the 2024 solar eclipse, then have students investigate solar eclipse science for themselves.
Learning Resources
- Teachable Moment
The Science of Solar Eclipses and How to Watch With NASA
Learn about the science behind solar eclipses, how to watch safely, and how to engage students in NASA science.
- Student Project
How to Make a Pinhole Camera
Learn how to make your very own pinhole camera to safely see a solar eclipse in action!
- Lesson
Model a Solar Eclipse
Students use simple materials to model a partial, annular, and total solar eclipse.
- Math Problem
Eclipsing Enigma: A ‘Pi in the Sky’ Math Challenge
In this illustrated math problem, students use pi to figure out how much of the Sun’s disk will be covered by the Moon during an eclipse and whether it’s a total or annular eclipse.
April 22 - Celebrate Earth Day With NASA
You may not immediately think of Earth science when you think of NASA, but it's a big part of what we do. Earth Day on April 22 is a great time to learn more about our Earth and climate science projects and missions, especially with the much anticipated NISAR mission taking to the skies in 2024 to track minute changes in the planet's surface, including those from natural hazards such as earthquakes, tsunamis, volcanoes and landslides.
Whether you want to focus on Earth’s surface and geology, climate change, extreme weather, or the water budget, we have an abundance of lessons, student projects and Teachable Moments to guide your way.
Learning Resources
- Collection
Earth Lessons for Educators
Discover a collection of standards-aligned STEM lessons all about Earth and climate change.
- Collection
Earth Activities for Students
Try these science and engineering projects, watch videos, and explore images all about the planet that we call home.
- Teachable Moments
Climate Change Collection
Explore this collection of Teachable Moments articles to get a primer on the latest NASA Earth science missions, plus find related education resources you can deploy right away!
May
May 6-10 – Give Thanks to Teachers and Black Holes
It may not seem like there's much to be gained from the dual programming of Black Hole Week and Teacher Appreciation Week on May 6-10, but sending students off to learn more about everyone's favorite spacely phenomenon might just give teachers the breather they deserve after a busy school year.
Have students dig into the science of black holes or even try out an experiment to learn how a black hole collision helped prove the existence of gravitational waves. Meanwhile, teachers can learn about all the ways their work has inspired us.
Learning Resources
-
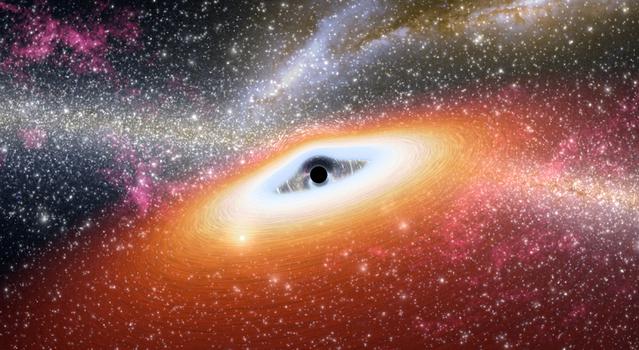 Slideshow
Black Holes: By the Numbers
What are black holes and how do they form?
- Lesson
Dropping In With Gravitational Waves
Students develop a model to represent the collision of two black holes, the gravitational waves that result and the waves' propagation through spacetime.
-
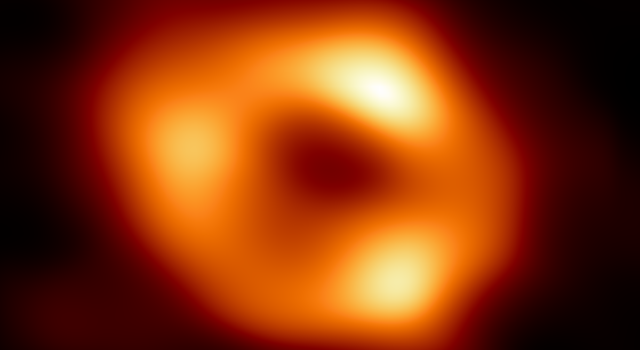 Articles
Teachable Moments: Black Holes
Learn about the latest discoveries in black hole science and how to make connections to what students are learning.
-
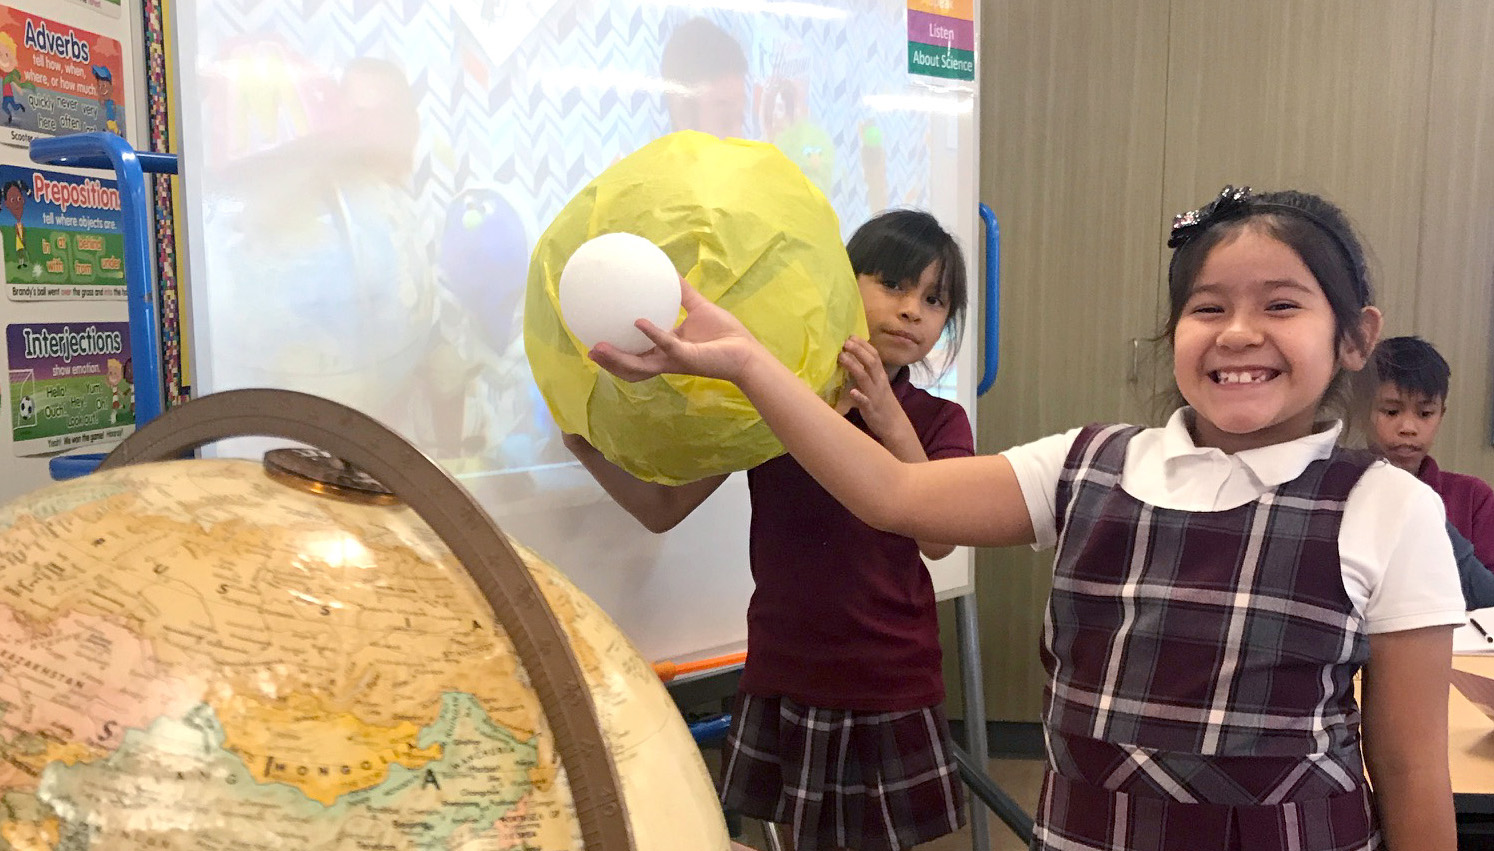 Share
ShareThank You, Teachers!
Employees at NASA's Jet Propulsion Laboratory give thanks to the teachers who helped them reach for the stars.
All Month – Launch Into Summer
Speaking of black holes, don't let students' learning fall into one as the summer gets into full swing. Send them off with links to these DIY summer projects. There's even more for parents and families on our Learning Space With NASA at Home page, which also has information to help direct students' learning during out-of-school time.
Learning Resources
- Student Resources
Summer Activities for Students
Explore Earth and space with these hands-on projects, slideshows, videos, and more for K-12 students.
-
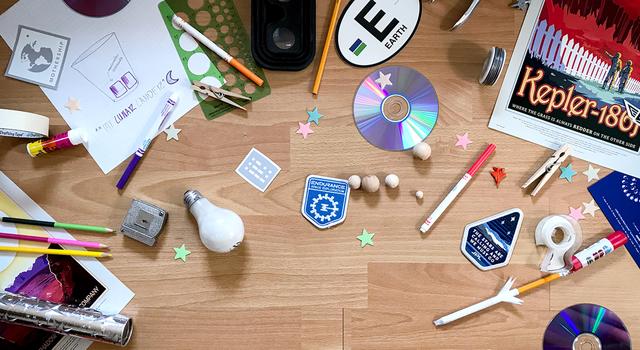 Student Resources
Learning Space With NASA
Explore space and science activities you can do with NASA at home. Find video tutorials, DIY projects, slideshows, games and more!
TAGS: Teachers, Classroom, Lessons, Educators, K-12, Parents, Students, Resources