Lesson .
.Using Light to Study Planets
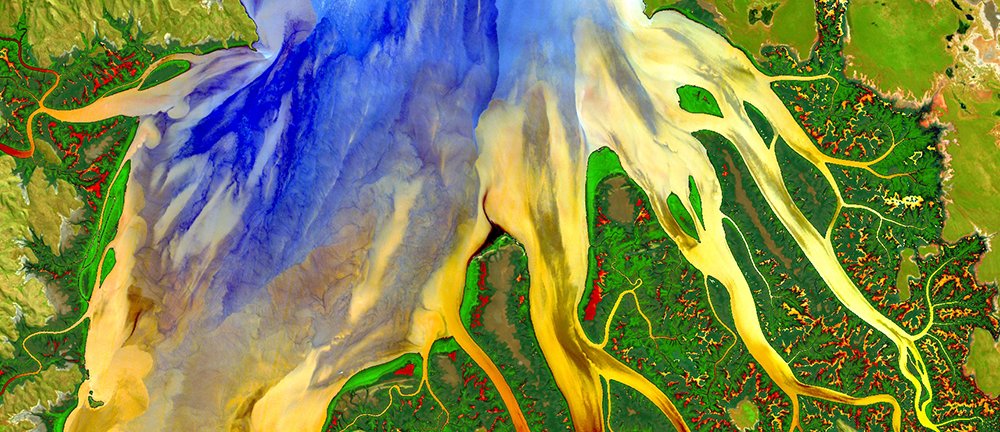
By combining remote sensing technology and spectroscopy, scientists can make discoveries about features and trends on Earth (and other planets) that are not visible to the naked eye, as in this image of Western Australia created using data captured by the Landsat-8 satellite.
Overview
In this activity, students will build a spectrometer using basic materials to observe the light emitted and absorbed by several sources. This will be used as a model for how NASA uses spectroscopy to determine the nature of elements found on Earth and other planets. For higher grades, this activity can also be used to discuss advanced spectroscopic topics, such as how NASA research is advancing spectroscopic techniques to teach us more about plant life on Earth.
Materials
- Half of a compact disc
- Empty cereal box
- Duct tape (or any completely opaque tape)
- 4 to 6 light sources (ceiling lights, computer monitors, candles, the sun, etc.)
- Colored pencils or markers
- Student Worksheet – Download PDF
- Optional: Candle, splint, and simple chemicals with unique spectra (as detailed in Extensions below)
Management
- Provide one set of the materials listed above per group.
- Safety Note: Break the CDs in half for students. This can be done safely by placing the disc between a book and the edge of a table and breaking the CD along the straight line to ensure a clean break. Wear gardening gloves for additional safety.
Background
NASA scientists often use a technique called “remote sensing” to study the composition of different elements and structures on planets. Remote sensing refers to making measurements without directly touching the object being measured. These images are one kind of remote-sensing measurement. But what we can see with the naked eye only tells us part of the story.
When we look out into the solar system and beyond, we use remote sensing to see things far beyond what we can see with our naked eye. For example, using remote sensing we’re able to detect the jets of water shooting out from Saturn’s moon Enceladus nearly 900 million miles away.

These images captured by NASA's Cassini spacecraft of Saturn's moon Enceladus show plumes shooting out from the moon's south pole. The image on the right was colorized to show details not visible to the naked eye in natural light.
In space exploration, NASA uses remote-sensing tools that are capable of seeing deeper into the electromagnetic spectrum than we can with our eyes. Because wavelengths in the electromagnetic spectrum are so fine, these tools allow us to quantify the amount of light as it moves. These movements are called reflection, absorption and re-emission spectra and they happen at very specific wavelengths. Further, because reflectance spectra come in myriad colors and at a finer resolution than what we can see, we can use these spectra to learn much more about how our planet is changing and the composition of other planets.
Upon its arrival at the Jovian system, the Europa Clipper spacecraft will use remote sensing as it studies Jupiter’s icy moon Europa. It will collect ultraviolet light in the onboard UV spectrograph to determine the composition of Europa’s atmospheric gases and surface materials. It will also gather infrared light with an IR spectrometer to map the composition and distribution of ices, salts, organic compounds, and the warmest hotspots on Europa.

This image from NASA's MESSENGER spacecraft uses spectral data to highlight various minerals, features and properties on Mercury.
Another way scientists are interested in using spectra is to develop techniques to measure how life on Earth is changing as a result of climate change. For example, one major player in climate change is carbon dioxide. We know that plant photosynthesis drives the global carbon cycle and ultimately provides energy for life on Earth. Because of a changing climate and increased human impact on our planet’s ecosystems, it is critical that we improve our capability to make highly resolved measurements related to photosynthesis and ecosystem health. Over the past few decades, NASA scientists and engineers have aimed to develop new – and validate current – remote sensing approaches that are responsive to vegetation changes around the world. Ultimately, we want to understand, for example, how the rainforest is responding to deforestation, or how the Arctic tundra might be greening as a result of melting permafrost and increasing temperatures. In general, two remote sensing techniques can be used to measure the changing pulse of the planet (i.e., our terrestrial ecosystems).
The first and most widely used set of information that comes from satellite imagery is measuring the colors of plants on the planet, most commonly in near-infrared (which is highly reflected by plants) and in red (which is highly absorbed by plants for photosynthesis). The difference between near-infrared and red parts of the spectrum can give us an idea of our planet’s “greenness” and tell us where and how much plant life there is. This technique is commonly done using NASA’s Landsat satellites and Moderate Resolution Imaging Spectrometer (MODIS) instrument.

This pair of infrared images from NASA's Landsat satellite shows China's Pearl River Delta in 1973 (top) and 2003 (bottom). Industrialization has replaced much of the area's vegetation, shown in red.
Another technique that effectively measures a leaf’s “pulse” uses solar-induced chlorophyll fluorescence, or SIF. SIF is re-radiated light energy emitted at longer wavelengths of the electromagnetic spectrum than were initially absorbed. It is measured using portions of the light in the electromagnetic spectrum that are absorbed by the sun’s atmosphere, then re-emitted, creating a very slight glow. Because the fluorescent glow is so faint, it cannot be measured using traditional reflectance. Until recently, measuring a plant’s glow using SIF had been too difficult simply because the light from cities was so much greater than this tiny amount of light. As we get more advanced at detecting this glow, NASA hopes to match data from older satellites with newer ones, such as the Orbiting Carbon Observatory, or OCO-2, to map this glow as a measure of actual photosynthesis. This would ultimately reduce uncertainties in not only the when and where, but also the why and how of land-atmosphere CO2 exchange. By coupling physics and biology in technology, we can measure the health of plants on Earth.
Procedures
Discuss with students the following types of spectra, and their applications:
- Continuous spectra, also called thermal or blackbody spectra, are emitted by any object that radiates heat. As shown in Figure 1, light is emitted from the sun in a continuous band of colors with every wavelength having some amount of electric and magnetic radiation. For example, when sunlight is passed through a prism, its light is spread out into its component colors.
 Credit: Spitzer Science Center.
Figure 1: A continuous visible light spectrum. Image credit: Spitzer Science Center.
- If you use a more precise spectrometer to look at the sun’s spectrum, you will notice the presence of dark lines, as shown in Figure 2 below. These lines are caused by gaseous elements in the sun’s atmosphere absorbing light at these wavelengths, so this type of spectrum is called an absorption spectrum. The atoms and molecules in a gas will absorb only certain wavelengths of light. The pattern of absorption is unique to each element and tells us what elements make up the sun’s atmosphere. Compare Figure 3, the absorption spectrum of hydrogen, with Figure 2. There are dark bands in the same part of both spectra, indicating the presence of hydrogen in the sun.
 Credit: Spitzer Science Center.
Figure 2 and 3: The absorption spectrum of the Sun and hydrogen. Image credit: Spitzer Science Center.
- An emission spectrum occurs when the atoms and molecules in a hot gas emit light at certain wavelengths, causing bright lines to appear in a spectrum. As with absorption spectra, the pattern of these lines is unique for each element. We can see emission spectra from comets, nebula and certain types of stars.
 Credit: Spitzer Science center.
Figure 4: The emission spectrum of hydrogen. Image credit: Spitzer Science center.
Have student groups define and differentiate between continuous, absorption and emission spectra using the attached student worksheet and figures before beginning construction of their spectrometer.
From the top corner of the cereal box, cut a line the same as the radius of the CD down each face of the box at a 60-degree angle. Use tape to secure the CD in the cereal box edge. The CD serves as our diffraction grating.- a device that splits colored light into its individual wavelengths, much like a prism.
Cut out a small square on the top of the cereal box originating from where you cut the CD slits. This will serve as a viewing window.
On the opposite end of the diffraction grating, about an inch or so down the from the top, cut a small slit from left to right. This can be done length-wise or width-wise on the box. Emphasize to the students that the cut should be as clean and narrow as possible as it will determine the quality of the spectra observed.
Use tape to mend the slit as needed, leaving only 1 to 2 millimeters of open space for light to enter the slit. If the slit is too narrow, the spectra will appear dim. If the slit is too broad, the spectra will appear blurry.
Be sure the cereal box is sealed so that the only way light can enter is from the slit or the viewing window.

Completed spectrometer with light source.
Point the slit toward the light sources to be explored – the closer the better. For sunlight, you can try reflecting the light off of a white sheet of paper and changing the distance of the paper from your device. Be certain not to point your device directly at the sun or put your eyes at risk! There is enough light on a sunny day for the device to work indirectly.

Light source and view through the spectrometer. Image credits: Spitzer Science Center and Jerry Zhu
Have students fill out their worksheet, drawing in their absorption spectra and predicted emission spectra. Encourage students to capture line resolution by indicating whether the lines are broad or thin, blurry or clear.


Discussion
- Students should discuss what impact our atmosphere has on the colors we observe.
- Would we see the same colors emitted and observed on Mars where the atmosphere is mostly carbon dioxide? What about the spectra of the sun as observed from Earth versus space? When observing the sun from space, you are are not looking through an oxygen and nitrogen atmosphere.
- From what we learned about NASA’s OCO-2 satellite, what solar-induced chlorophyll fluorescence (SIF) observations would you expect when observing photosynthesis as deforestation continues and carbon dioxide levels rise?
- If we can see certain lines representative of elements, how can we use this technique to determine the composition of other worlds? Which spectral lines are being absorbed in your samples? What could these correspond to (what exists between our eyes and the spectrometer)?
Extensions
Have students explore several elements or chemicals. Simple chemicals available at home or in most chemistry labs have unique spectra and flame ionization spectra that will provide visibly different patterns on the CD. Using a candle and wooden splint, have one student take a scoop of salt and place it under the candle. It will burn yellow. Potassium chloride burns purple. Strontium chloride burns red.

This image shows examples of spectra for various elements.
About the Author

Brandon Rodriguez
Educator Professional Development Specialist, NASA-JPL Education Office