


Teachable Moments | September 14, 2020
The Science of Wildfires


Update: Sept. 14, 2020 – This feature, originally published on Aug. 23, 2016, has been updated to include information on the 2020 fires and current fire research.
In the News
Once again, it’s fire season in the western United States with many citizens finding themselves shrouded in wildfire smoke. Late summer in the West brings heat, low humidity, and wind – optimal conditions for fire. These critical conditions have resulted in the August Complex Fire, the largest fire in California's recorded history. Burning concurrently in California are numerous other wildfires, including the SCU Lightning Complex fire, the third-largest in California history.
Fueled by high temperatures, low humidity, high winds, and years of vegetation-drying drought, more than 7,700 fires have engulfed over 3 million acres across California already this year. And the traditional fire season – the time of year when fires are more likely to start, spread, and consume resources – has only just begun.
Because of their prevalence and effects on a wide population, wildfires will remain a seasonal teachable moment for decades to come. Keep reading to find out how NASA studies wildfires and their effects on climate and communities. Plus, explore lessons to help students learn more about fires and their impacts.
How It Works
With wildfires starting earlier in the year and continuing to ignite throughout all seasons, fire season is now a year-round affair not just in California, but also around the world. In fact, the U.S. Forest Service found that fire seasons have grown longer in 25 percent of Earth's vegetation-covered areas.

This animation shows how FireSat would use a network of satellites around the Earth to detect fires faster than ever before. | + Expand image
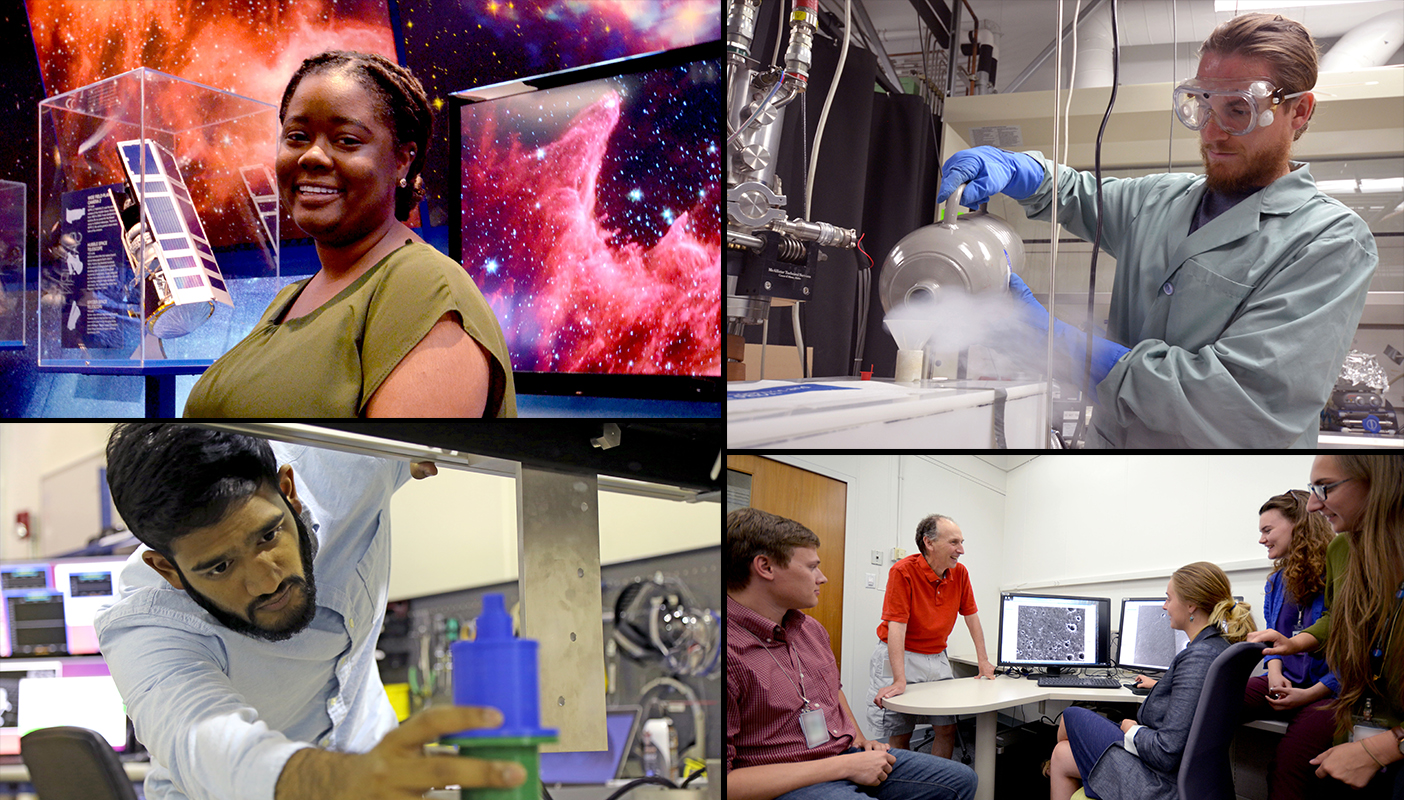
For NASA's Jet Propulsion Laboratory, which is located in Southern California, the fires cropping up near and far are a constant reminder that its efforts to study wildfires around the world from space, the air, and on the ground are as important as ever.
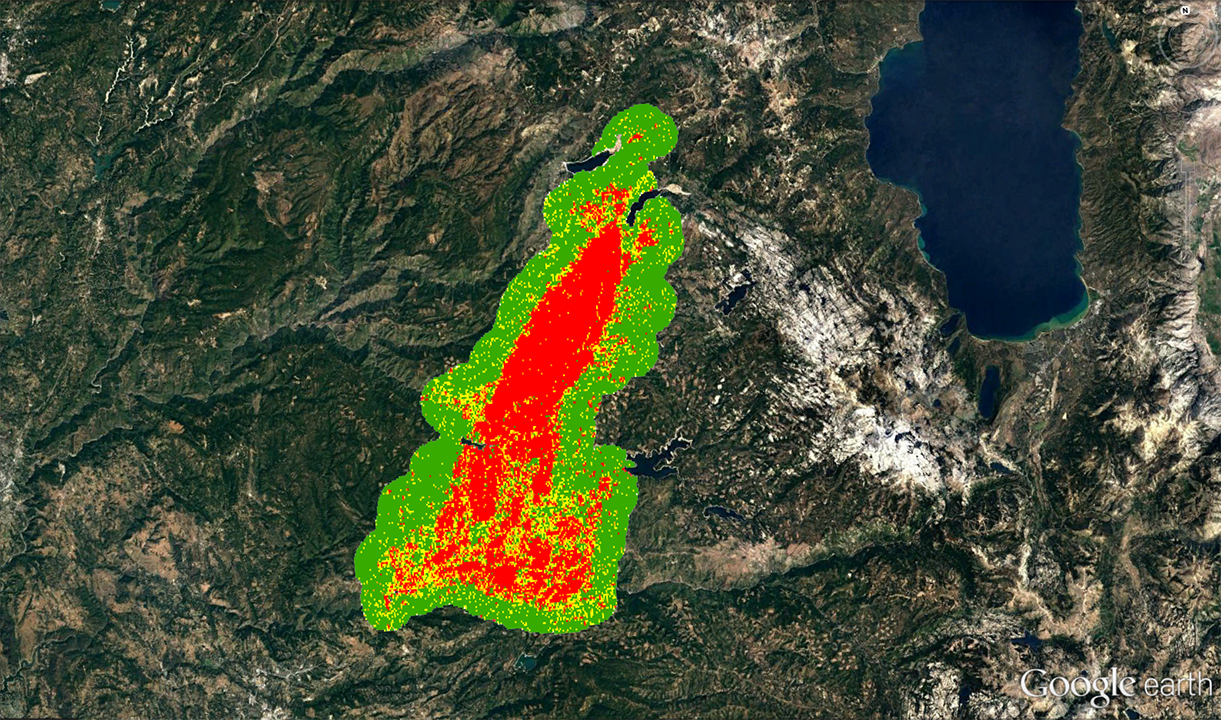
JPL uses a suite of Earth satellites and airborne instruments to help better understand fires and aide in fire management and mitigation. By looking at multiple images and types of data from these instruments, scientists compare what a region looked like before, during, and after a fire, as well as how long the area takes to recover.
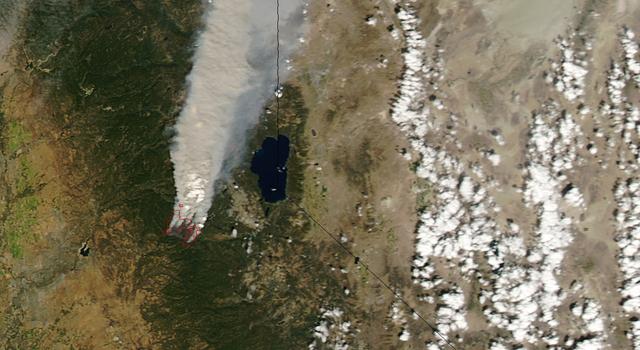
While the fire is burning, scientists watch its behavior from an aerial perspective to get a big-picture view of the fire itself and the air pollution it is generating in the form of smoke filled with carbon monoxide and carbon dioxide.
Natasha Stavros, a wildfire expert at JPL, joined Zach Tane with the U.S. Forest Service during a Facebook Live event to discuss some of these technologies and how they're used to understand wildfire behavior and improve wildfire recovery.
Additionally, JPL worked with a startup in San Francisco called Quadra Pi R2E to develop FireSat, a global network of satellites designed to detect wildfires and alert firefighting crews faster.
Using these technologies, NASA scientists are gaining a broader understanding of fires and their impacts.
Why It's Important
One of the ways we often hear wildfires classified is by how much area they have burned. Though this is certainly of some importance, of greater significance to fire scientists is the severity of the fire. Wildfires are classified as burning at different levels of severity: low, medium, and high. Severity is a function of intensity, or how hot the fire was, and its spread rate, or the speed at which it travels. A high-severity fire is going to do some real damage. (Severity is measured by the damage left after the fire, but can be estimated during a fire event by calculating spread rate and measuring flame height which indicates intensity.)
The impacts of wildfires range from the immediate and tangible to the delayed and less obvious. The potential for loss of life, property, and natural areas is one of the first threats that wildfires pose. From a financial standpoint, fires can lead to a downturn in local economies due to loss of tourism and business, high costs related to infrastructure restoration, and impacts to federal and state budgets.
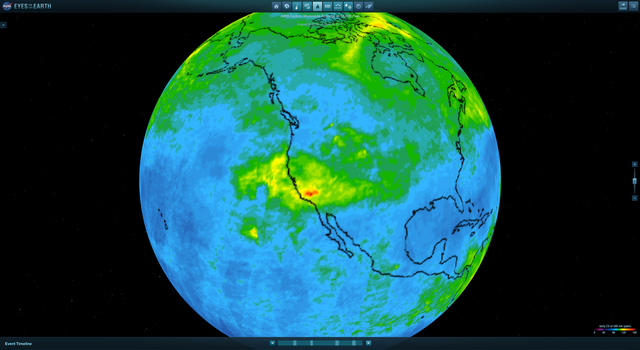
The release of greenhouse gases like carbon dioxide and carbon monoxide is also an important consideration when thinking about the impacts of wildfires. Using NASA satellite data, researchers at the University of California, Berkeley, determined that between 2001 and 2010, California wildfires emitted about 46 million tons of carbon, around five to seven percent of all carbon emitted by the state during that time period.

In California and the western United States, longer fire seasons are linked to changes in spring rains, vapor pressure, and snowmelt – all of which have been connected to climate change. Wildfires serve as a climate feedback loop, meaning certain effects of wildfires – the release of CO2 and CO – contribute to climate change, thereby enhancing the factors that contribute to longer and stronger fire seasons.
While this may seem like a grim outlook, it’s worth noting that California forests still act as carbon sinks – natural environments that are capable of absorbing carbon dioxide from the atmosphere. In certain parts of the state, each hectare of redwood forest is able to store the annual greenhouse gas output of 500 Americans.
Studying and managing wildfires is important for maintaining resources, protecting people, properties, and ecosystems, and reducing air pollution, which is why JPL, NASA, and other agencies are continuing their study of these threats and developing technologies to better understand them.
Teach It
Have your students try their hands at solving some of the same fire-science problems that NASA scientists do with these two lessons that get students in grades 3 through 12 using NASA data, algebra, and geometry to approximate burn areas, fire-spread rate and fire intensity:
-
Fired Up Over Math: Studying Wildfires from Space
Students learn how scientists assess wildfires using remote sensing and solve related math problems, appropriate for various grade levels.
Grades 3-12
Time 30 mins - 1 hr
-
Pixels on Fire
Students use mobile devices and computers to learn about remote sensing and satellite data to determine when and where wildfires have started.
Grades 4-8
Time 30 mins - 1 hr
Explore More
- Wildfire Images from NASA Earth Observatory
- NASA/JPL FireSat Press Release
- SciJinks: Can Meteorologists Help Fight Wildfires?
- Soberanes Fire: Image Captured by NASA's Terra Spacecraft
- Let's Clear the Air: The Danger of Forest Fire Smoke to Firefighters
- NASA Climate Change News: "Local Winds Play a Key Role in Some Megafires
- NASA Climate Change News: "Studying Weather to Help See the Likelihood of Fires"
Lyle Tavernier contributed to this feature.
TAGS: teachable moments, wildfires, science, Earth Science, Earth, Climate Change, Climate TM


Meet JPL Interns | October 15, 2018
Seeing Science: Using Visualizations to Help NASA Study Wildfires

With wildfires around the world occurring increasingly often and burning over a longer portion of the year, scientists at NASA's Jet Propulsion Laboratory are working to understand whether the blazes could have long-term impacts on global climate change. In some respects, it’s a tough question to answer – not because of an absence of data, but because of an overabundance. That’s where intern Jarod Boone, a computer engineering student at Brown University, comes in. As part of a program at JPL that brings together designers, computer programmers and scientists to answer data-heavy science questions using visualizations, Boone spent this summer helping climate researchers visualize tens of thousands of files containing wildfire data collected by instruments on NASA’s Terra satellite. Boone shared what it was like visualizing wildfire data as more than a dozen wildfires burned across California (where JPL is located) and how he never quite got used to JPLers’ tendency to speak in acronyms.
What are you working on at JPL?
I'm doing the programming for a data visualization tool to help researchers who are using the Terra satellite analyze wildfire data and how high these fires inject into the atmosphere. That's a question scientists are really concerned with because you have all these fires burning up matter, and all the matter that they burn goes into the air and just floats around for many, many days afterward. We don't really know how exactly that affects global climate change, so it's good to take a look at the data.
Meet JPL Interns
Read stories from interns pushing the boundaries of space exploration and science at the leading center for robotic exploration of the solar system.
Have you discovered anything so far from these visualizations?
Not quite yet. So the [Data to Discovery Visualization Program] that I’m a part of is sort of a unique program here at JPL. We have two designers and three computer science teams, and we have three projects that we work on. It's very design focused. So in the course of my projects, we have several weeks of what we call contextual inquiry, which is going in and doing interviews, creating prototypes and basically trying to get an idea of what scientists do for their workflow, because it’s kind of hard to conceive of what you would do to answer a scientific question if you don't have a scientific background. So we spend a lot of time getting to know what the scientists are trying to accomplish. We're trying to make the best interface possible for them to use this data. That's actually a huge problem in science: There's a huge barrier to entry with a lot of these data sets, so it discourages things like exploratory science.
Have you been adding all the recent wildfires in the western U.S. to your data set?
I'm mostly working with older fires because it takes a bit of time to digitize the fires that are imaged by the Terra satellite. They have to go through this process where they take a bunch of images of the fire – because you have these flat images and you're trying to get plume height and the satellite is moving – and they essentially need to stitch together the images of the fire to get an idea of how high the smoke plume is, which is quite a process. And it has to be done one by one. But there are enough older fires for us to work with.
You're from Massachusetts, a state that doesn't have a lot of wildfires. Has being in Southern California during all the wildfires this summer changed your perspective on how to go about these visualizations?
It's a little hard because the visualizations and working with all the satellite data is so detached, and they're really abstracted away from any actual fires. So it's like I'm just seeing all these data points and getting all these data products, like optical depth. I don't really know what that is, so when I see a real fire, I'm like, "Whoa, that's what that is." But there's not really a huge cognitive connection. It's definitely cool to be able to work with something that's pretty pertinent and definitely a problem in California.
What's the ultimate goal of the project both for you and for JPL?
For JPL, it is to refine our ideas of climate models and better take fires into account. The global climate models right now do a fairly poor job of taking fires into account because it's really difficult. They happen so sporadically. It's not a fluid weather system. It's these discrete fires, and they're just huge dumps of energy. How do we account for that? So that's definitely the end goal for JPL.
I am not a climate scientist. I will not be doing any updates to the climate models, but I do hope to encourage exploratory research. And I'm sort of trying to introduce principles of design and human-centered interfacing and accessibility to climate scientists. Actually, one of my mentors was very excited about what I was working on and had me submit an abstract for the [American Geophysical Union Fall Meeting]. So visualizing is important. You should be able to conceive of the data you're using.
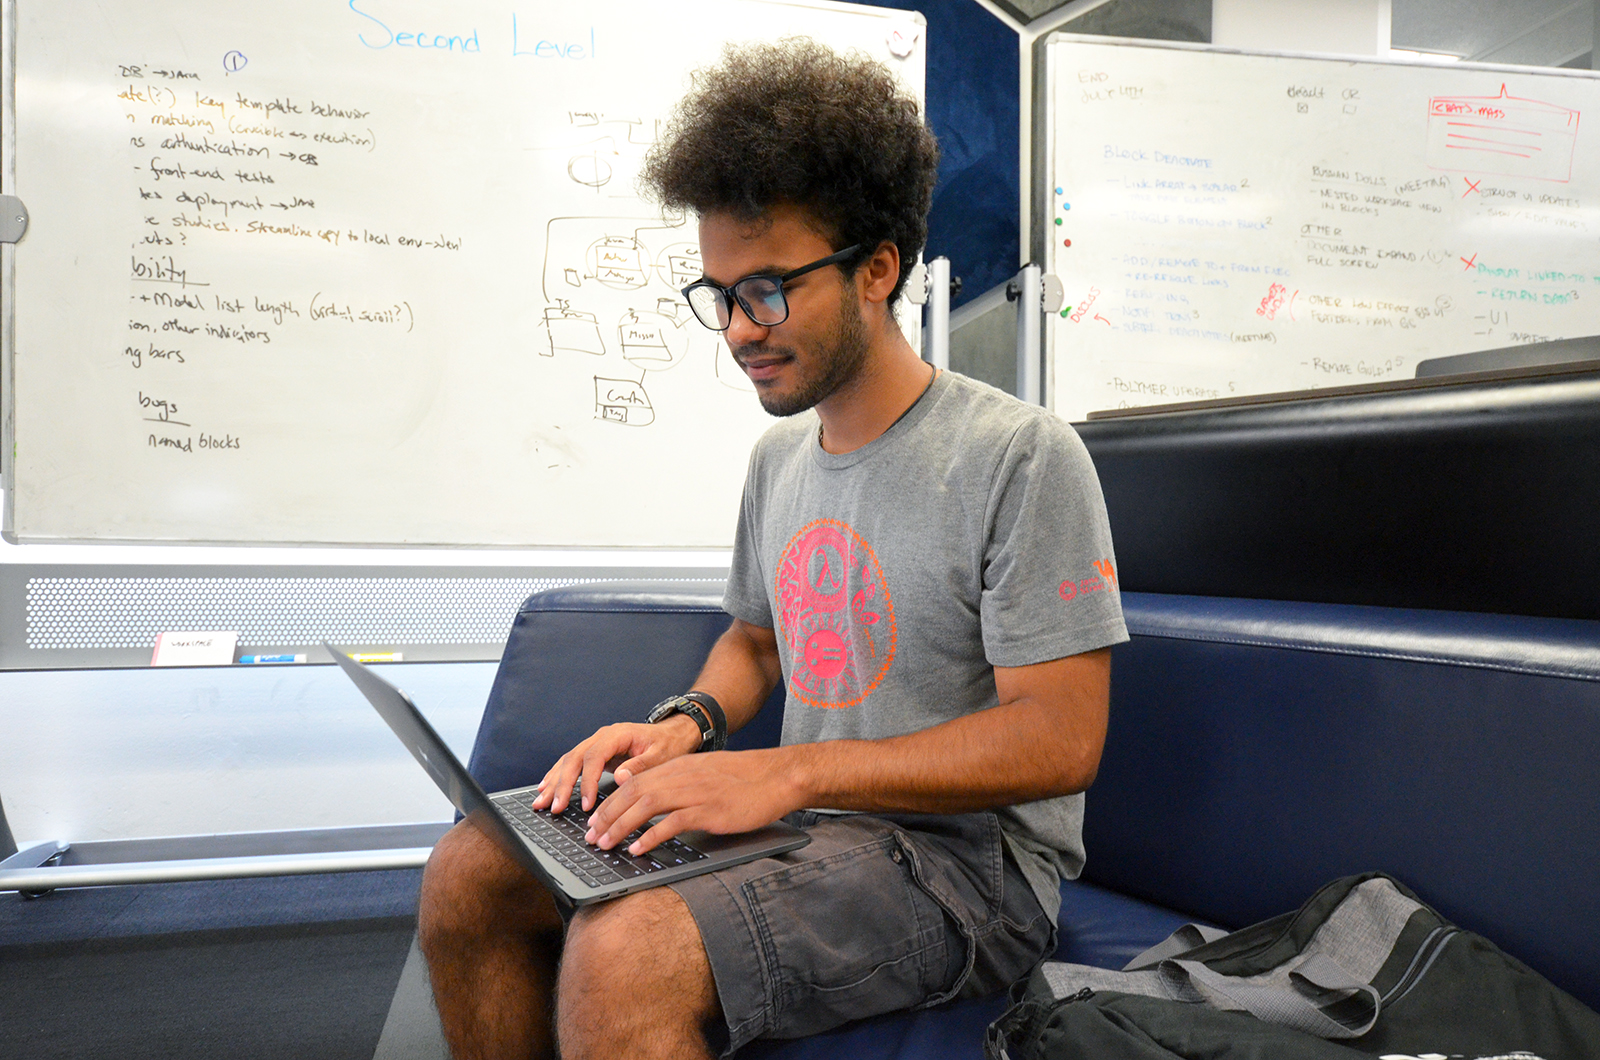
Image credit: NASA/JPL-Caltech/Kim Orr | + Expand image
How did you get involved in the program that brought you to JPL to do this work?
I had done a lot of visualization work at my school. Not on purpose, tangentially. I worked at the Brown University Center for Computation and Visualization, so we had a lot of people coming in wanting to do some kind of research visualization and they had a lot of technical problems. So I sort of got sucked into the visualization and research-aid world. One of my bosses knew Santiago Lombeyda, one of the mentors in this program from Caltech, and he said he was looking for data visualization students who were well versed in that and able to do computer science. JPL seemed pretty cool, so I decided to apply.
What are you thinking you want to do eventually?
So long, long term, I have this vision of humanizing computer systems. A lot of software developers don't know entirely how systems work. A lot of consumers are still confused by computers, and we're still using a bunch of folders spread out to represent files rather than something more intuitive or something that represents the data better. The fact that most users need to troubleshoot online to figure out how to use their computer and answer how to fix certain problems is a problem. I feel like we know enough about computers at this point and this generation is, in general, literate enough about computer science to be able to understand what's going on. We can possibly do a lot better making operating systems transparent. That's what I would like to do. I think that would be a cool project.
Is there a particular place that you'd want to do that?
In practice, I would just like to work a little bit in industry, doing systems development either in hardware or software. It's really cool to work with a data system like this, a satellite that has a lot of nuanced issues with how you get the data and what you can do with the data and how you transmit it back and forth and, at the end, what you do with that data problem.
What's an average day like for you?
So we actually split up a decent amount of our time between here and Caltech [which manages JPL for NASA]. Most days I'll have meetings with our research groups just to touch base and see what's happening. On Mondays, we'll have [critiques] all day, which is where our mentors review our projects up to that point. Then, pretty much the rest of the day I'll spend meeting with my designers and programming. Sometimes I go for walks or explore the campus a little bit. But most of the time, I'm just holed up doing the computer thing.
What's been the most JPL or NASA unique experience you've had so far?
During the second meeting that I had with my mentor, Abigail Nastan, she used like five acronyms in the same sentence. And I was just, "Can you just use words?" [Laughs.] You guys should just have an acronyms cheat-sheet for interns.
Also, going to the Mars Yard, sitting in the rocks. Every experience here is a NASA experience.
If you could travel to any place in space, where would you go and what would you do there?
In space? I mean, Earth is really cool. I guess I'd probably go to Jupiter, just because something fishy is going on there. [Laughs.] That planet is too big. Also, I just don't trust gas giants. What do you mean, you don't have a surface? I definitely would not go on Jupiter – I'd just watch it from afar.
Explore JPL’s summer and year-round internship programs and apply at: https://www.jpl.nasa.gov/edu/intern
The laboratory’s STEM internship and fellowship programs are managed by the JPL Education Office. Extending the NASA Office of Education’s reach, JPL Education seeks to create the next generation of scientists, engineers, technologists and space explorers by supporting educators and bringing the excitement of NASA missions and science to learners of all ages.
TAGS: Internships, Higher Education, Career Guidance, Computer Science, Visualizations, Data, Earth Science, Wildfires, Black History Month

Edu News | August 23, 2016
What We Did Over Your Summer Vacation
This summer, while many of us were sleeping in and avoiding heavy school work, lots of exciting things were happening in and around our solar system! Here's a guide to launching the 2016 school year right and turning those stellar events into educational connections from NASA.
Science on Fire
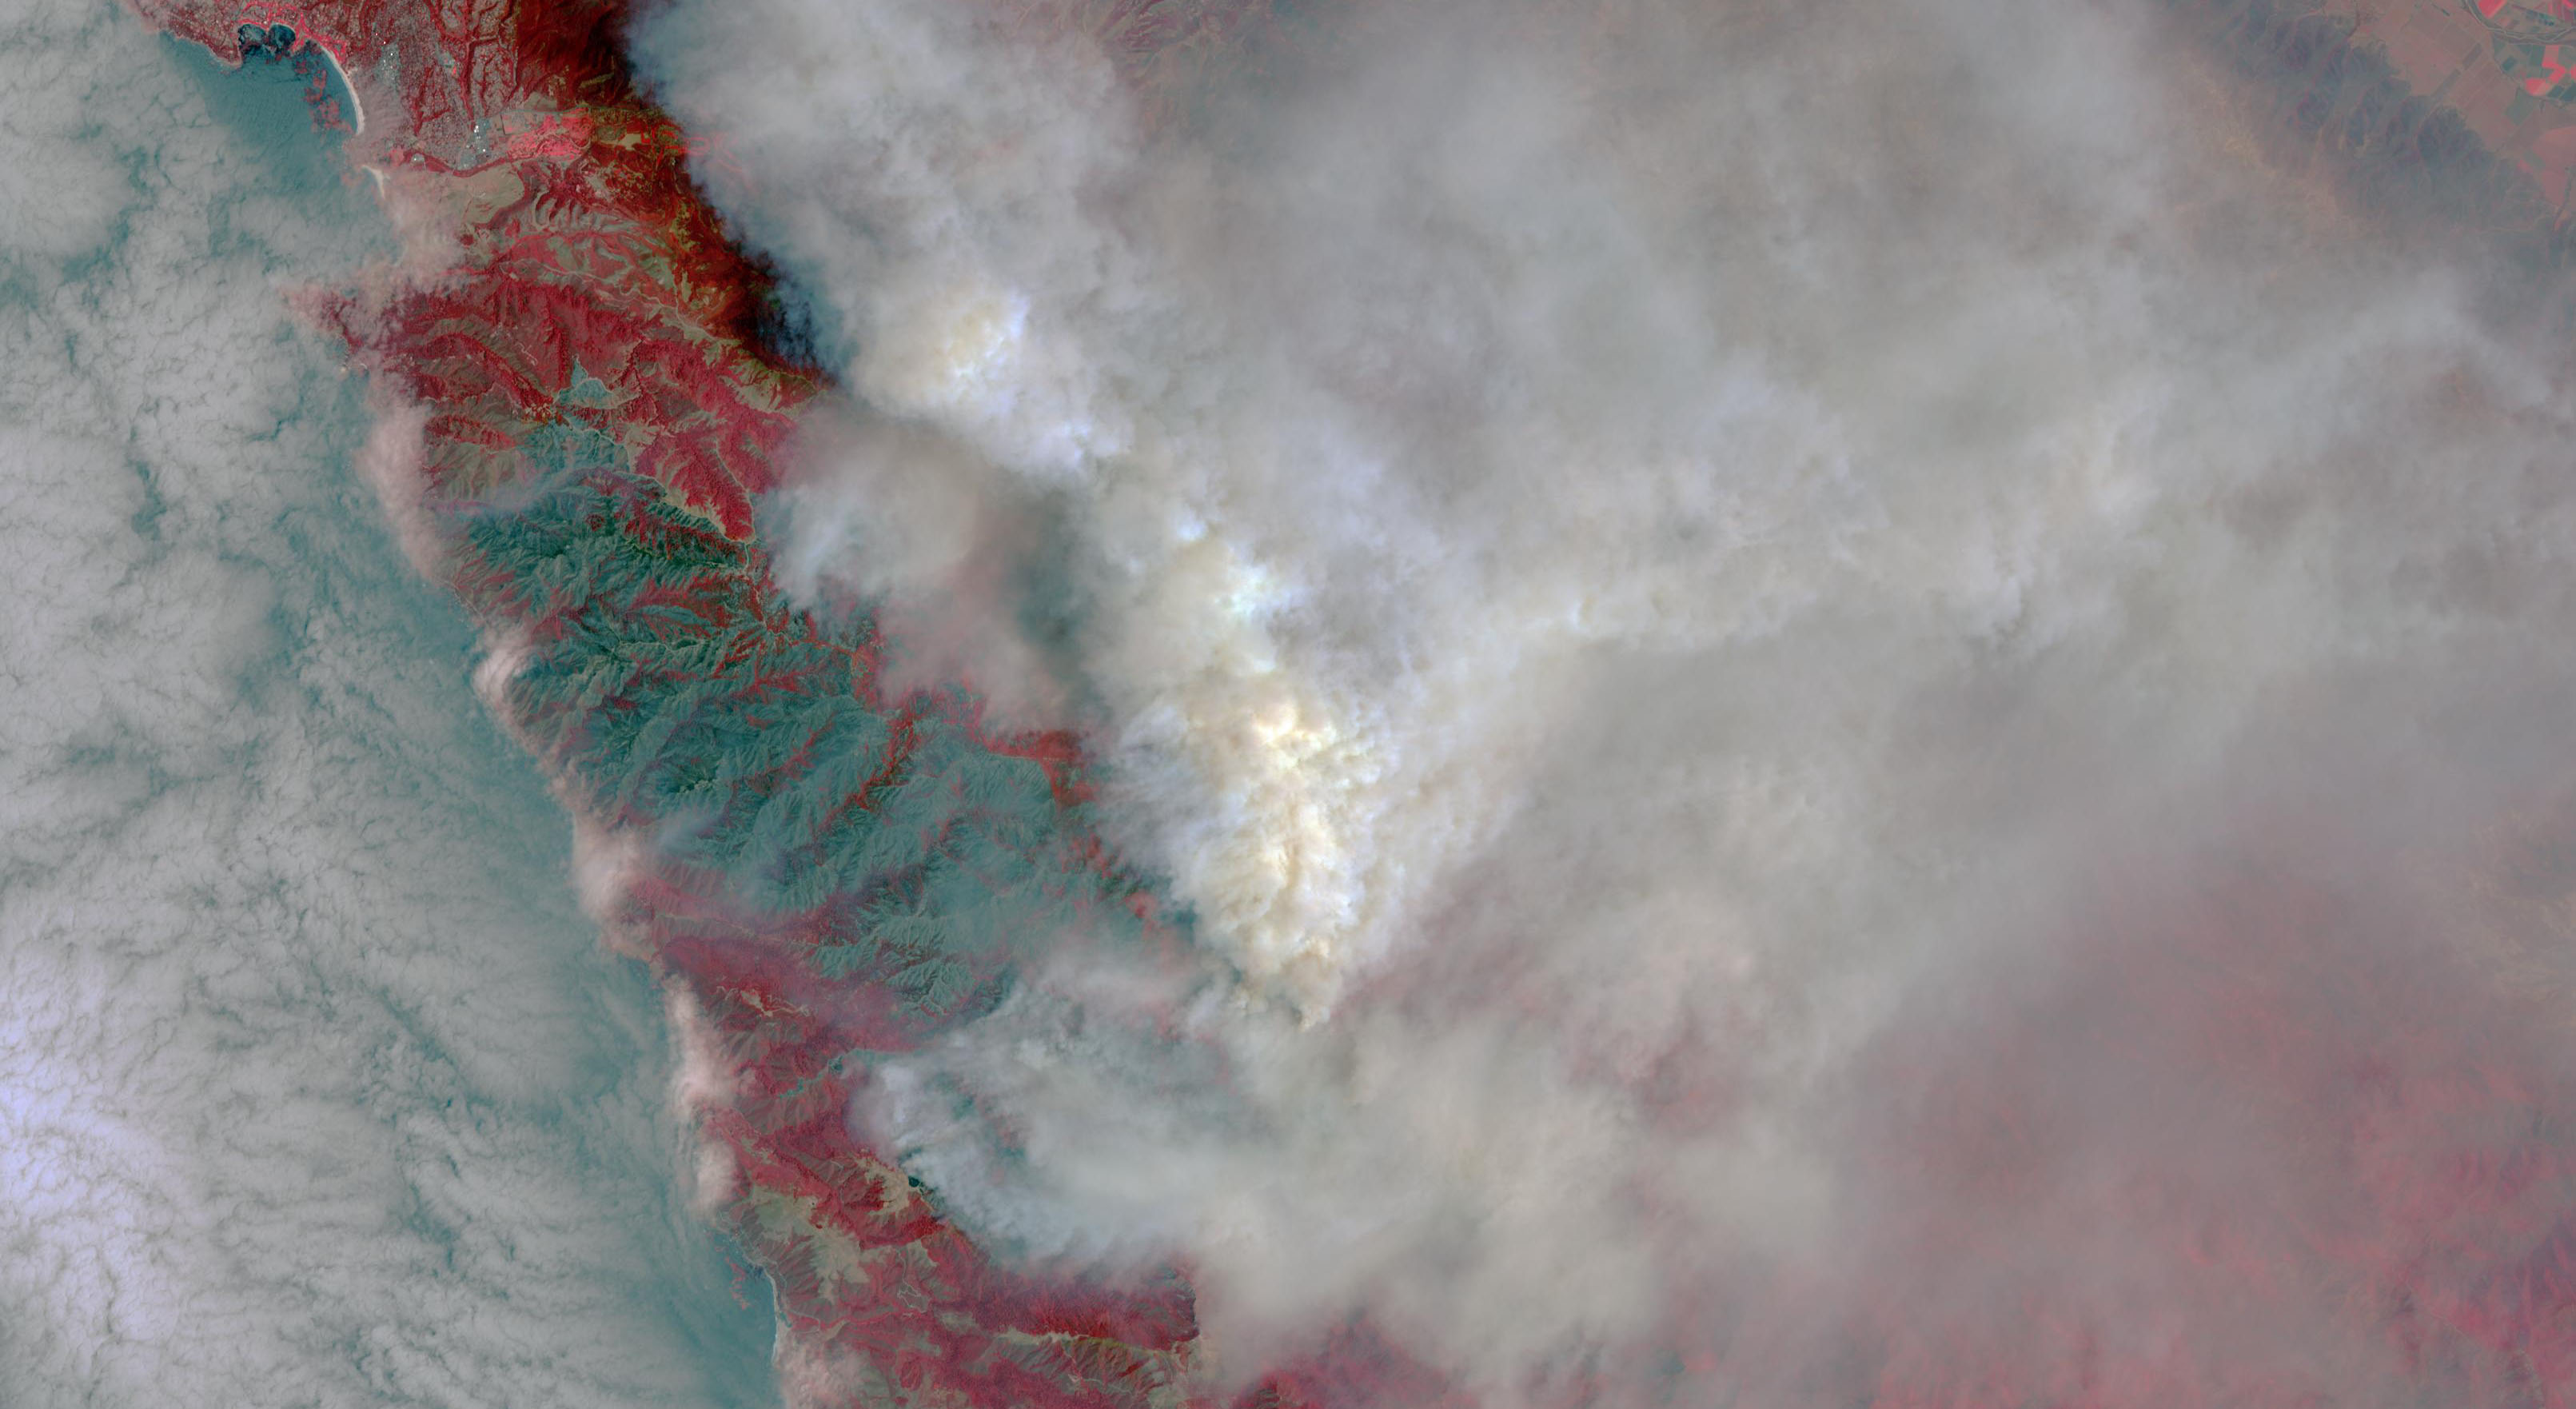
Here at home, on Earth, it is fire season in many places in the Northern Hemisphere. Fire season comes about with warmer temperatures, dry air, and dry brush. Once a fire gets started in these conditions, it can rapidly spread and become out of control, especially when high winds are involved. This summer has already witnessed some dangerous fires including the Sand Fire in Southern California and the Soberanes Fire near Big Sur on the Central California coast. Beyond the immediate threat from flames, smoke degrades air quality and burn scars leave hillsides vulnerable to rain-induced mudslides.
NASA satellites and airborne instruments are helping scientists better understand wildfires and their impacts on our changing climate. And in the immediate term, they are helping firefighters track wildfires and respond to people and structures in risk areas.
Check out JPL's latest Teachable Moment to find out more about how scientists are studying wildfires, what they're learning and why it's important. And get links to two new lessons for students in grades 3-12 that have students use NASA data, algebra and geometry to approximate burn areas, fire-spread rate and fire intensity. (You can also go straight to the new lessons at: Fired Up Over Math: Studying Wildfires from Space and Pixels on Fire)
And speaking of Earth science, find out how you can get a free bulletin board featuring posters and lithographs about NASA Earth science and missions for your classroom!
Greetings from Jupiter
On July 4, just in time for a fireworks spectacle, the Juno spacecraft went into orbit around Jupiter. Juno launched from Earth aboard a huge rocket and had been hurtling toward Jupiter for nearly five years. Getting into orbit around Jupiter was a real nail-biter here at NASA's Jet Propulsion Laboratory (which helps manage the mission) and we are all very happy everything went as planned. Juno’s mission is to study the origin, core and magnetic fields of our solar system’s largest planet. Juno will orbit Jupiter for only about 20 months before Jupiter’s intense radiation environment takes a toll on the spacecraft.
Communicating with a spacecraft as far away as Juno is a challenge that involves a lot of planning and teamwork. Try out this new lesson for young learners that demonstrates this process and provides practice with number concepts, counting and geometry, and data collection in a concrete, active manner.
Wish you had your very own Juno spacecraft you could use to uncover secrets beneath Jupiter? Check out this easy-to-build Juno model that uses household objects and can be used in a game with friends and family!
Explore more about Juno with these related lessons and videos:
