


Teachable Moments | April 22, 2024
Tracking Tiny Movements Means Big Impacts for Earth Science

Find out how the upcoming NISAR mission, an Earth satellite designed to capture detailed views of our planet's changing surface, will provide new insights into everything from natural disasters to climate change. Plus, connect it all to STEM learning.
The next addition to NASA’s fleet of Earth Science orbiters is launching in 2024 and will represent a monumental leap forward in how we monitor our changing planet. The NISAR mission is a collaboration between NASA and the Indian Space Research Organisation that’s designed to monitor and study tiny movements of Earth’s surface from events like natural disasters and climate change.
Read on to find out how NISAR is pushing the boundaries of Earth science from space. Plus, learn how you can bring science and engineering from the mission to your students.
How NISAR Works
NISAR is among the most advanced radar systems on an Earth science mission to date due to its supersized antenna reflector, use of synthetic aperture radar, and ability to observe Earth in two different radar frequencies simultaneously.
Hear mission experts describe how the NISAR satellite will track our changing Earth in fine detail. Credit: NASA/JPL-Caltech
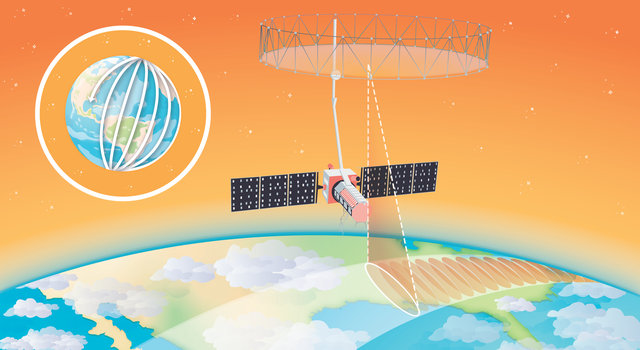
Extending above the spacecraft like a giant catcher's mitt, NISAR’s antenna reflector is 39 feet (12 meters) wide – the largest ever launched as part of a NASA Earth-observing mission. This antenna creates an observational window, or swath, of the surface beneath the spacecraft that is 150 miles (242 kilometers) wide. The swath size is determined by the radar wavelength and antenna size, which is important because there is a direct relationship between antenna size and the resolution of images and data that can be captured by NISAR.
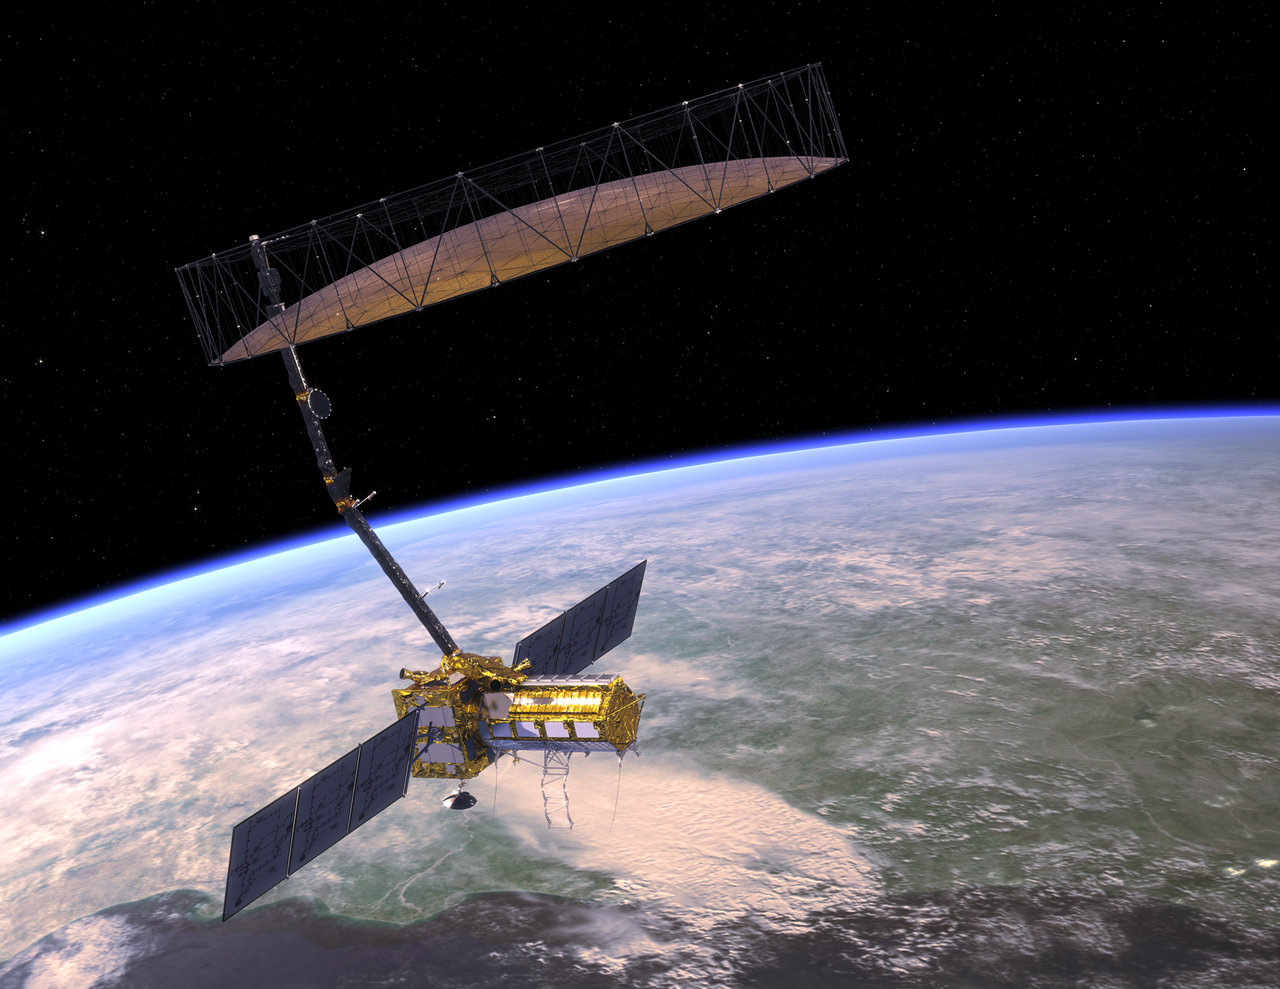
NISAR's antenna reflector extends above the spacecraft like a catcher's mitt and is engineered to help the mission get an unprecedented view of Earth's surface. Credit: NASA/JPL-Caltech | + Expand image
We typically want the best resolution possible, but we’re limited by the size of the antenna we can build and deploy in space. Conventionally, the resolution on a satellite is a function of the wavelength it uses and the size of the antenna. The larger the wavelength, the bigger the antenna needs to be to get quality images. At typical radar wavelengths, with a 12 meter diameter reflector, the best achievable resolution would be as coarse as 10s of kilometers, which is not very useful for observing features on Earth at the human scale.
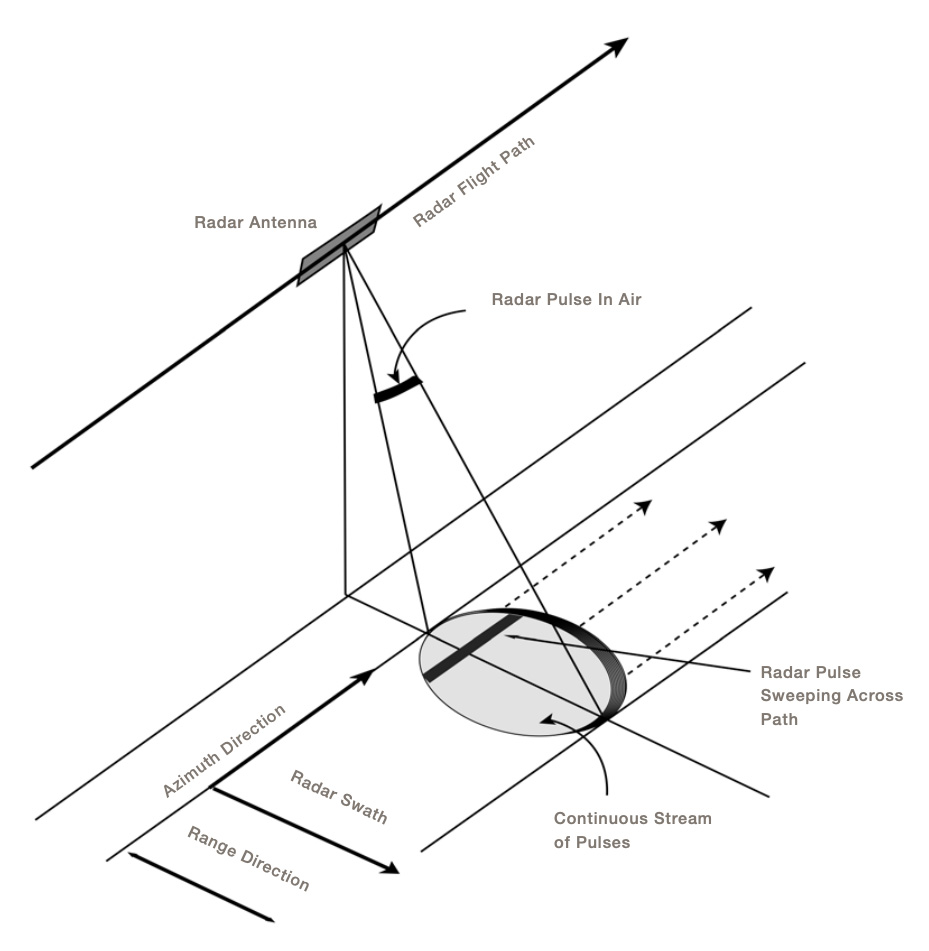
This diagram shows how synthetic aperature radar works by sending multiple radar pulses to an area on the ground from an antenna passing overhead. Credit: NASA | + Expand image
This is why NISAR utilizes an approach called synthetic aperture radar, or SAR, to synthetically magnify the resolution achievable from the antenna. With SAR, the spacecraft sends multiple signals, or pulses, to an area as it flies overhead. Each signal gets reflected back to the spacecraft, which is meticulously designed to “catch” the reflected signals thanks to its position and velocity. Each signal in the sequence is then focused into a single high-resolution image, creating an effect as if the spacecraft is using a much larger antenna.
Radar uses radio wavelengths, which are longer than those of visible light, allowing us to see through clouds and sometimes even tree coverage to the ground below, depending on the frequency of the radio waves. We’re also able to interpret a lot of information about the surface from the way the signal returns back to the orbiter. This is because NISAR will measure the amount of scatter, or dispersion, of the signal as compared to when it was originally transmitted.
For example, a rigid, sharp angled building will bounce the signal back to the receiver differently than a leafy tree. Different radio frequencies are better used for different surfaces because they are influenced by the type of surface being analyzed. To this end, NISAR is the first mission to use two different radar frequencies simultaneously. The L-Band can be used to monitor heavier vegetation and landscapes while the S-Band is better tuned for lighter vegetation and crop growth. The two wavelengths in general extend the range of sensitivity of the measurement to smaller and larger changes.
This combination of tools and features will allow NISAR to construct global maps of changes in the position of any given pixel at a scale of just centimeters as well as subtle changes in reflectivity due to land cover changes on all land and ice surfaces twice every 12 days. The resolution combined with repetition will allow scientists to monitor the changes taking place on our planet in a matter of days more comprehensively than ever before.
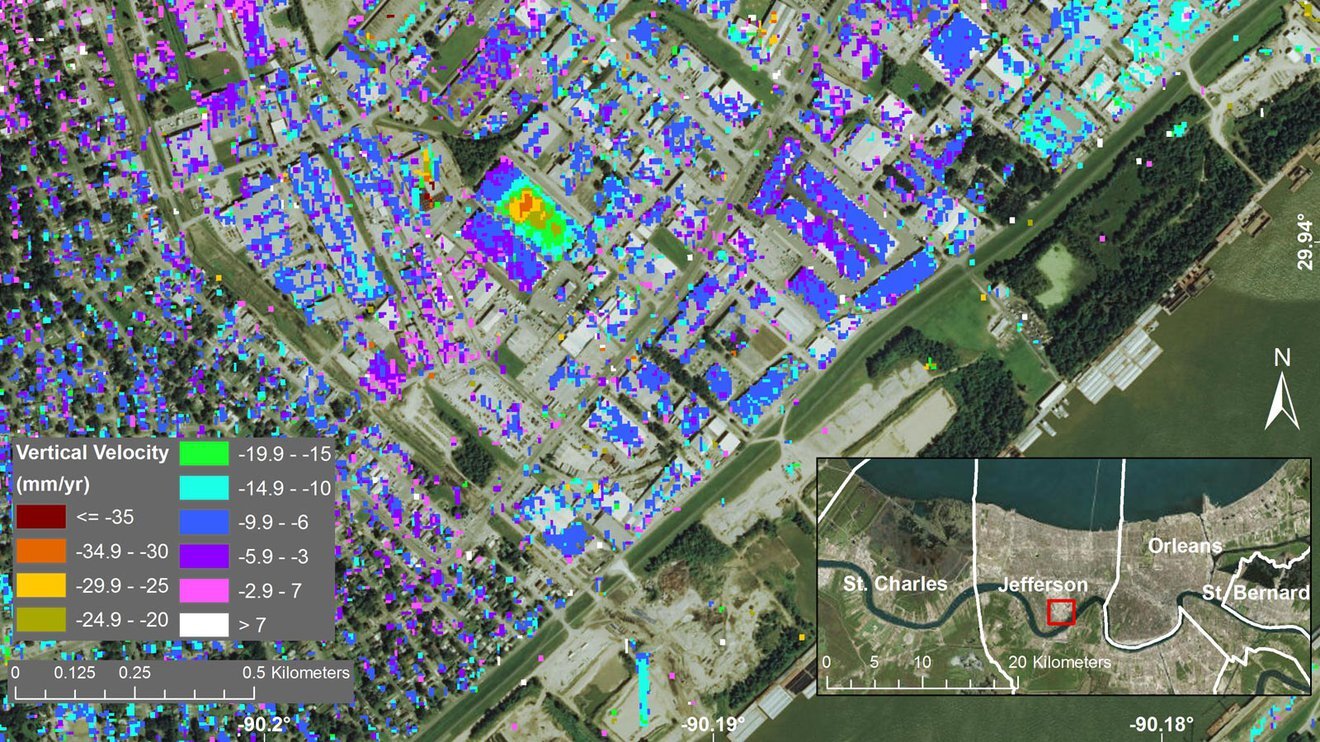
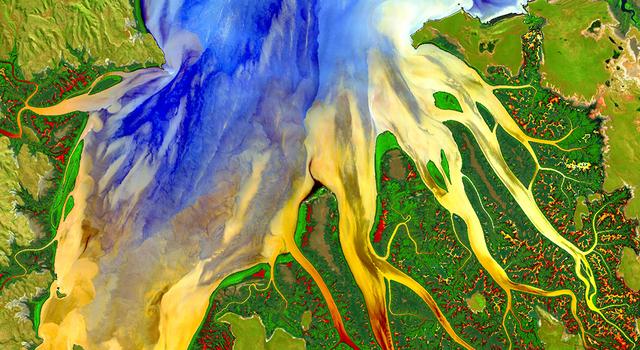
This satellite image of New Orleans is overlaid with synthetic aperature radar data from the UAVSAR instrument to show the rate at which the land was sinking in a section of New Orleans from June 2009 to July 2012. Credit: NASA/JPL-Caltech, Esri | › Learn more
What the NISAR Mission Will Show Us
Because of the massive amount of data produced by NISAR, we’ll be able to closely monitor the impacts of environmental events including earthquakes, landslides, and ice-sheet collapses. Data from NISAR could even be used to assess the risk of natural hazards.
Scientists can use NISAR to monitor tiny movements in Earth’s surface in areas prone to volcanic eruptions or landslides. These measurements are constructed using what’s called an interferogram, which looks at how the maps generated for each pass of the spacecraft have changed over time. For example, we could see immediate changes to the topography after an earthquake with an interferogram made from images NISAR collected shortly before and soon after the event.
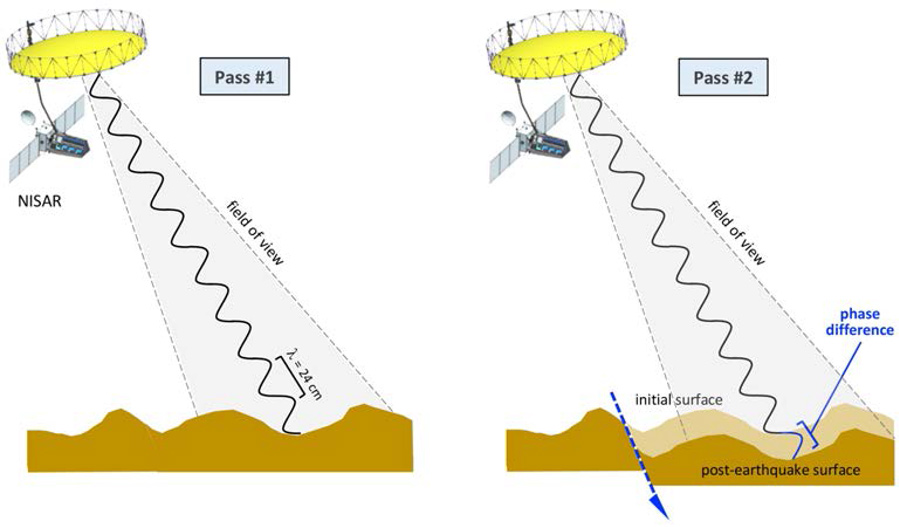
Using interferometry, as shown in this diagram, NISAR can capture changes or deformation in land surfaces, such as after an earthquake. | + Expand image
By tracking and recording these events and other movements on the surface leading up to natural disasters, it may be possible to identify warning signs that can improve detection and disaster response.
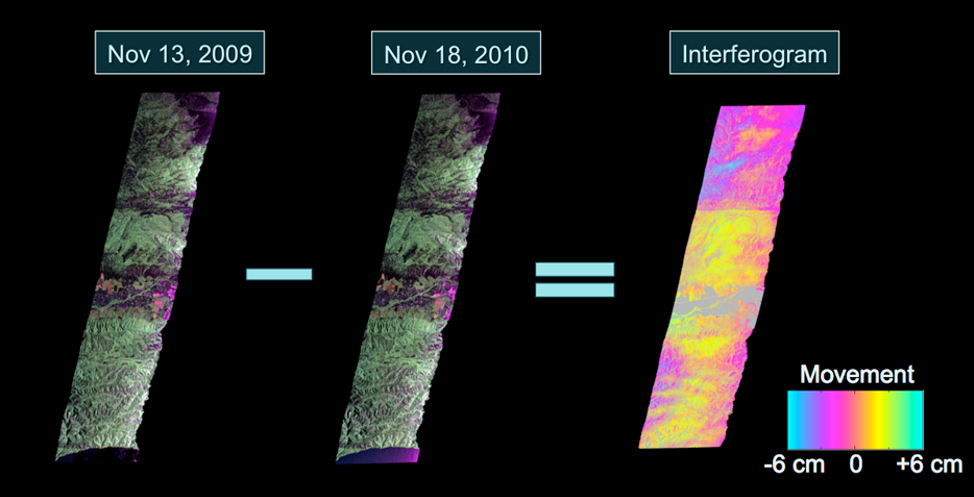
The first two images in this series were captured by the UAVSAR instrument during two separate passes over California's San Andreas Fault about a year apart. The two images were then combined to create the third image, which an interferogram that shows how the surface changed between the two passes of the instrument. Credit: NASA/JPL-Caltech | + Expand image
And NISAR isn’t just limited to studying the solid Earth. As missions prior have done, it will also be able to generate maps of polar ice sheets over time and detect changes in permafrost based on the regional movement of the soil below. These measurements will give climate scientists a clear picture of how much the ice is moving and deforming due to climate change and where it is thawing as the ground warms.
Additionally, NISAR can track land usage, deforestation, sea levels, and crustal deformation, informing scientists about the impacts of environmental and climate change on Earth.
Follow Along With NISAR
NISAR is scheduled to launch in 2024 from the Satish Dhawan Space Centre in Sriharikota, India, and will enter a polar orbit 460 miles (747 kilometers) above Earth. For the first 90 days after launch, the spacecraft will undergo checks and commissioning before beginning scientific observations for a primary mission designed to last three years.
Science from the mission will be downlinked to both NASA and ISRO ground stations below with data and the tools to process it freely available for download and use to all professional and citizen scientists.
Visit NASA’s NISAR mission page for the latest updates about the mission.
Teach Earth Science With NISAR
With the launch of NISAR, we will be better able to monitor and mitigate natural disasters and understand the effects of climate change. Bring the fleet of NASA Earth Science missions to your classroom with the following lessons and activities:
Lessons
-
 Math Problem
Orbit Observation: A ‘Pi in the Sky’ Math Challenge
In this illustrated math problem, students use the mathematical constant pi to figure out how much data the NISAR spacecraft collects every day.
Subject Math
Grades 7-12
Time Less than 30 mins
-
 Lesson
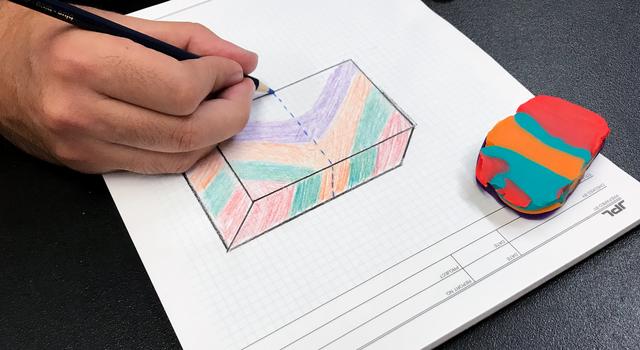
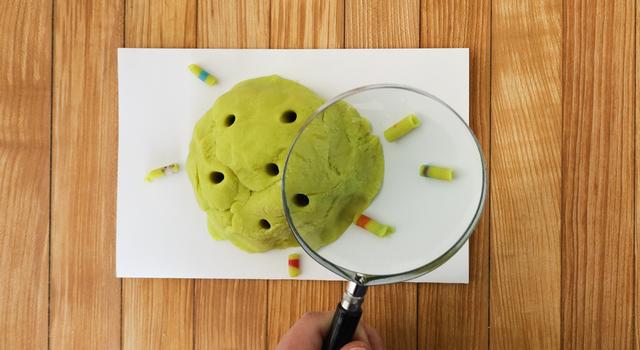
Modeling Crustal Folds
Students use playdough to model how Earth’s crust is bent and folded by tectonic plates over geologic time.
Subject Science
Grades 6-12
Time 30-60 mins
-
 Lesson
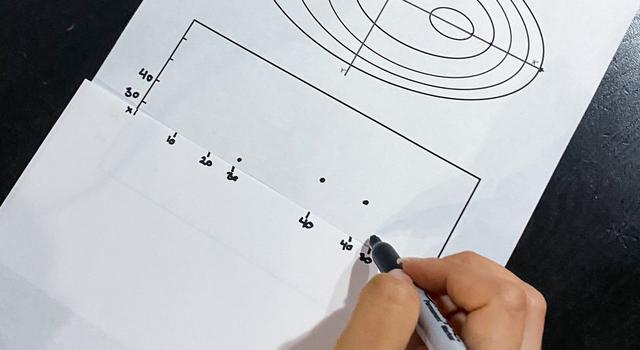
Making Topographic Maps
Students draw and interpret topographic maps while learning about technology used to map Earth's surface, the seafloor, and other worlds.
Subject Science
Grades 6-12
Time 1-2 hrs
-
 Lesson
Using Light to Study Planets
Students build a spectrometer using basic materials as a model for how NASA uses spectroscopy to determine the nature of elements found on Earth and other planets.
Subject Science
Grades 6-11
Time 2+ hrs
-
 Lesson
Modeling the Water Budget
Students use a spreadsheet model to understand droughts and the movement of water in the water cycle.
Subject Science
Grades 5-8
Time 30-60 mins
-
 Lesson
Fired Up Over Math: Studying Wildfires from Space
Students learn how scientists assess wildfires using remote sensing and solve related math problems, appropriate for various grade levels.
Subject Math
Grades 3-12
Time 30-60 mins
-
 Lesson
Earth Science Data Visualizations – How to Read a Heat Map
Students learn to read, interpret and compare “heat map” representations of Earth science data.
Subject Science
Grades 4-12
Time 30-60 mins
-
 Lesson
Lessons in Sea-Level Rise
What is sea-level rise and how does it affect us?
Subject Science
Grades 5-12
Time 30-60 mins
-
 Collection
Earth Science Lesson Collection
Discover a collection of standards-aligned STEM lessons all about Earth and climate change.
-
 Collection
Climate Change Lesson Collection
Explore a collection of standards-aligned STEM lessons for students that get them investigating climate change along with NASA.
Student Projects and Activities
-
 Collection
Exploring Earth Activities Collection
Try these science and engineering projects, watch videos, and explore images all about the planet that we call home.
-
 Collection
Climate Change Activities Collection
Learn about climate change and its impacts with these projects, videos, and slideshows for students.
Articles
-
 Collection
Teachable Moments in Climate Change
Explore this collection of Teachable Moments articles to get a primer on the latest NASA Earth science missions, plus find related education resources you can deploy right away!
-
 Collection
Earth Minute Video Series
This series of animated white-board videos for students of all ages explains key concepts about Earth science, missions, and climate change.
-
 Expert Talk
Monitoring Earth from Space
In this educational talk, NASA experts discuss how we build spacecraft to study climate, then answer audience questions.
- Interactive: NASA Eyes on Earth
- Images: NASA Earth Observatory
- Gallery: Images of Climate Change
- Infographic: Sea Level Rise
Videos
Explore More
Websites
Facts & Figures
Multimedia
TAGS: K-12 Education, Resources, Earth Science, Climate Change, NISAR


Edu News | January 16, 2024
Doing the Math on Why We Have Leap Day

Leap day, Feb. 29, happens every four years because of a mismatch between the calendar year and Earth's orbit. Learn how it works, and get students engaged in leap day STEM.
You may have noticed that there's an extra day on your calendar this year. That's not a typo – it's leap day! Leap day is another name for Feb. 29, a date that typically comes around every four years, during a leap year.
Why doesn't Feb. 29 appear on the calendar every year?
The length of a year is based on how long it takes a planet to revolve around the Sun. Earth takes about 365.2422 days to make one revolution around the Sun. That's about six hours longer than the 365 days that we typically include in a calendar year. As a result, every four years, we have about 24 extra hours that we add to the calendar at the end of February in the form of leap day.
Without leap day, the dates of annual events, such as equinoxes and solstices, would slowly shift to later in the year, changing the dates of each season. After only a century without leap day, summer wouldn’t start until mid-July!
But the peculiar adjustments don't end there. If Earth revolved around the Sun in exactly 365 days and six hours, this system of adding a leap day every four years would need no exceptions. However, Earth takes a little less time than that to orbit the Sun. Rounding up and inserting a 24-hour leap day every four years adds about 45 extra minutes to every four-year leap cycle. That adds up to about three days every 400 years. To correct for that, years that are divisible by 100 don't have leap days unless they’re also divisible by 400.
If you do the math, you'll see that the year 2000 was a leap year, but 2100, 2200 and 2300 will not be.
Have students learn more about leap years with this article from NASA's Space Place, then have them do the math for themselves with this leap day problem set. You can also have students write a letter or poem to be opened on the next leap day or get them learning about orbits across the solar system.
And since we've got an extra 24 hours this year, don't forget to take a little time to relax!
Educator Resources
-
 Problem Set
Leap Day Math
In this problem set, students calculate the difference between the calendar year and Earth's orbital period to determine when leap years occur.
Subject Math
Grades 5-8
Time Less than 30 mins
-
 Collection
Solar System Scale & Size Lessons
Explore a collection of standards-aligned lessons all about the size and scale of our solar system.
-
 Educator Guide
Planetary Poetry
Have students write a poem they can open and re-read next leap day!
Subject Science
Grades 2-12
Time 1-2 hrs
Student Resources
-
 Article
What Is a Leap Year?
Get the answer in this article from NASA Space Place. Plus, learn if other planets have leap years!
-
 Article
How Long Is a Year on Other Planets?
Get the answer in this article from NASA Space Place.
-
 Collection
All About the Size and Scale of the Solar System
Learn how big and far away the planets are with these projects and activities.
TAGS: K-12 Education, Math, Leap Day, Leap Year, Events, Space, Educators, Teachers, Parents, Students, STEM, Lessons, Earth Science, Earth

Teachable Moments | December 8, 2022
NASA Mission Takes a Deep Dive Into Earth's Surface Water

Explore how and why the SWOT mission will take stock of Earth's water budget, what it could mean for assessing climate change, and how to bring it all to students.
Update: Dec. 15, 2022 – NASA, the French space agency, and SpaceX are now targeting 3:46 a.m. PST (6:46 a.m. EST) on Friday, Dec.16, for the launch of the Surface Water and Ocean Topography (SWOT) satellite. Visit NASA's SWOT launch blog for the latest updates.
NASA is launching an Earth-orbiting mission that will map the planet’s surface water resources better than ever before. Scheduled to launch on Dec. 16 from Vandenberg Space Force Base in California, the Surface Water and Ocean Topography, or SWOT mission is the latest international collaboration designed to monitor and report on our home planet. By providing us with a highly detailed 3D view of rivers, lakes, and oceans, SWOT promises to improve our understanding of Earth’s water cycle and the role oceans play in climate change, as well as help us better respond to drought and flooding.
Read on to find out why we're hoping to learn more about Earth's surface water, get to know the science behind SWOT's unique design, and follow along with STEM teaching and learning resources.
Why It's Important
Observing Earth from space provides scientists with a global view that is important for understanding the whole climate system. In the case of SWOT, we will be able to monitor Earth’s surface water with unprecedented detail and accuracy. SWOT will provide scientists with measurements of water volume change and movement that will inform our understanding of fresh water availability, flood hazards, and the mechanisms of climate change.
Scientists and engineers provide an overview of the SWOT mission. Credit: NASA/JPL-Caltech | Watch on YouTube
Water Flow
Scientists use a variety of methods to track Earth’s water. These include stream and lake gauges and even measurements from space such as sea surface altimetry and gravitational measurements of aquifer volumes. Monitoring of river flow and lake volume is important because it can tell us how much freshwater is readily available and at what locations. River flow monitoring can also help us make inferences about the downstream environmental impact. But monitoring Earth’s surface water in great detail with enough frequency to track water movement has proven challenging. Until now, most monitoring of river flow and lake levels has relied on water-flow and water-level gauges placed across Earth, which requires that they be accessible and maintained. Not all streams and lakes have gauges and previous space-based altimetry and gravitational measurements, though useful for large bodies of water, have not been able to adequately track the constant movement of water through smaller rivers or lakes.
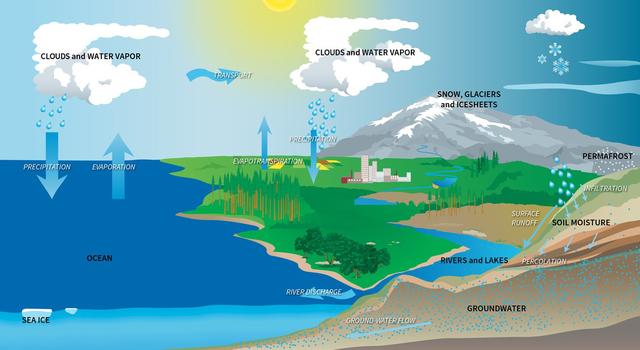
Here's why understanding Earth’s "water budget" is an important part of understanding our planet and planning for future water needs.
SWOT will be able to capture these measurements across the globe in 3D every 21 days. The mission will monitor how much water is flowing through hundreds of thousands of rivers wider than 330 feet (100 meters) and keep a close watch on the levels of more than a million lakes larger than 15 acres (6 hectares). Data from the mission will be used to create detailed maps of rivers, lakes, and reservoirs that will enable accurate monitoring to provide a view of freshwater resources that is not reliant on physical access. Meanwhile, SWOT’s volumetric measurements of rivers, lakes, and reservoirs will help hydrologists better track drought and flooding impacts in near-real-time.
Coastal Sea Level Rise
SWOT will measure our oceans with unprecedented accuracy, revealing details of ocean features as small as 9 miles (15 kilometers) across. SWOT will also monitor sea levels and tides. Though we have excellent global sea level data, we do not have detailed sea level measurements near coastlines. Coastal sea levels vary across the globe as a result of ocean currents, weather patterns, land changes, and other factors. Sea levels are rising faster than ever, and higher sea levels also mean that hurricane storm surges will reach farther inland than ever before, causing substantially more damage than the same category of hurricanes in the past. SWOT will be able to monitor coastal sea level variations and fill gaps in the observations we currently have from other sources.
What is sea level rise and what does it mean for our planet? | › View Transcript
Ocean Heat Sinks
Further contributing to our understanding of the role Earth’s oceans play in climate change, SWOT will explore how the ocean absorbs atmospheric heat and carbon, moderating global temperatures and climate change. Scientists understand ocean circulation on a large scale and know that ocean currents are driven by temperature and salinity differences. However, scientists do not currently have a good understanding of fine-scale ocean currents, where most of the ocean's motion-related energy is stored and lost. Circulation at these fine scales is thought to be responsible for transporting half of the heat and carbon from the upper ocean to deeper layers. Such downward ocean currents have helped to mitigate the decades-long rise in global air temperatures by absorbing and storing heat and carbon away from the atmosphere. Knowing more about this process is critical for understanding the mechanisms of global climate change.
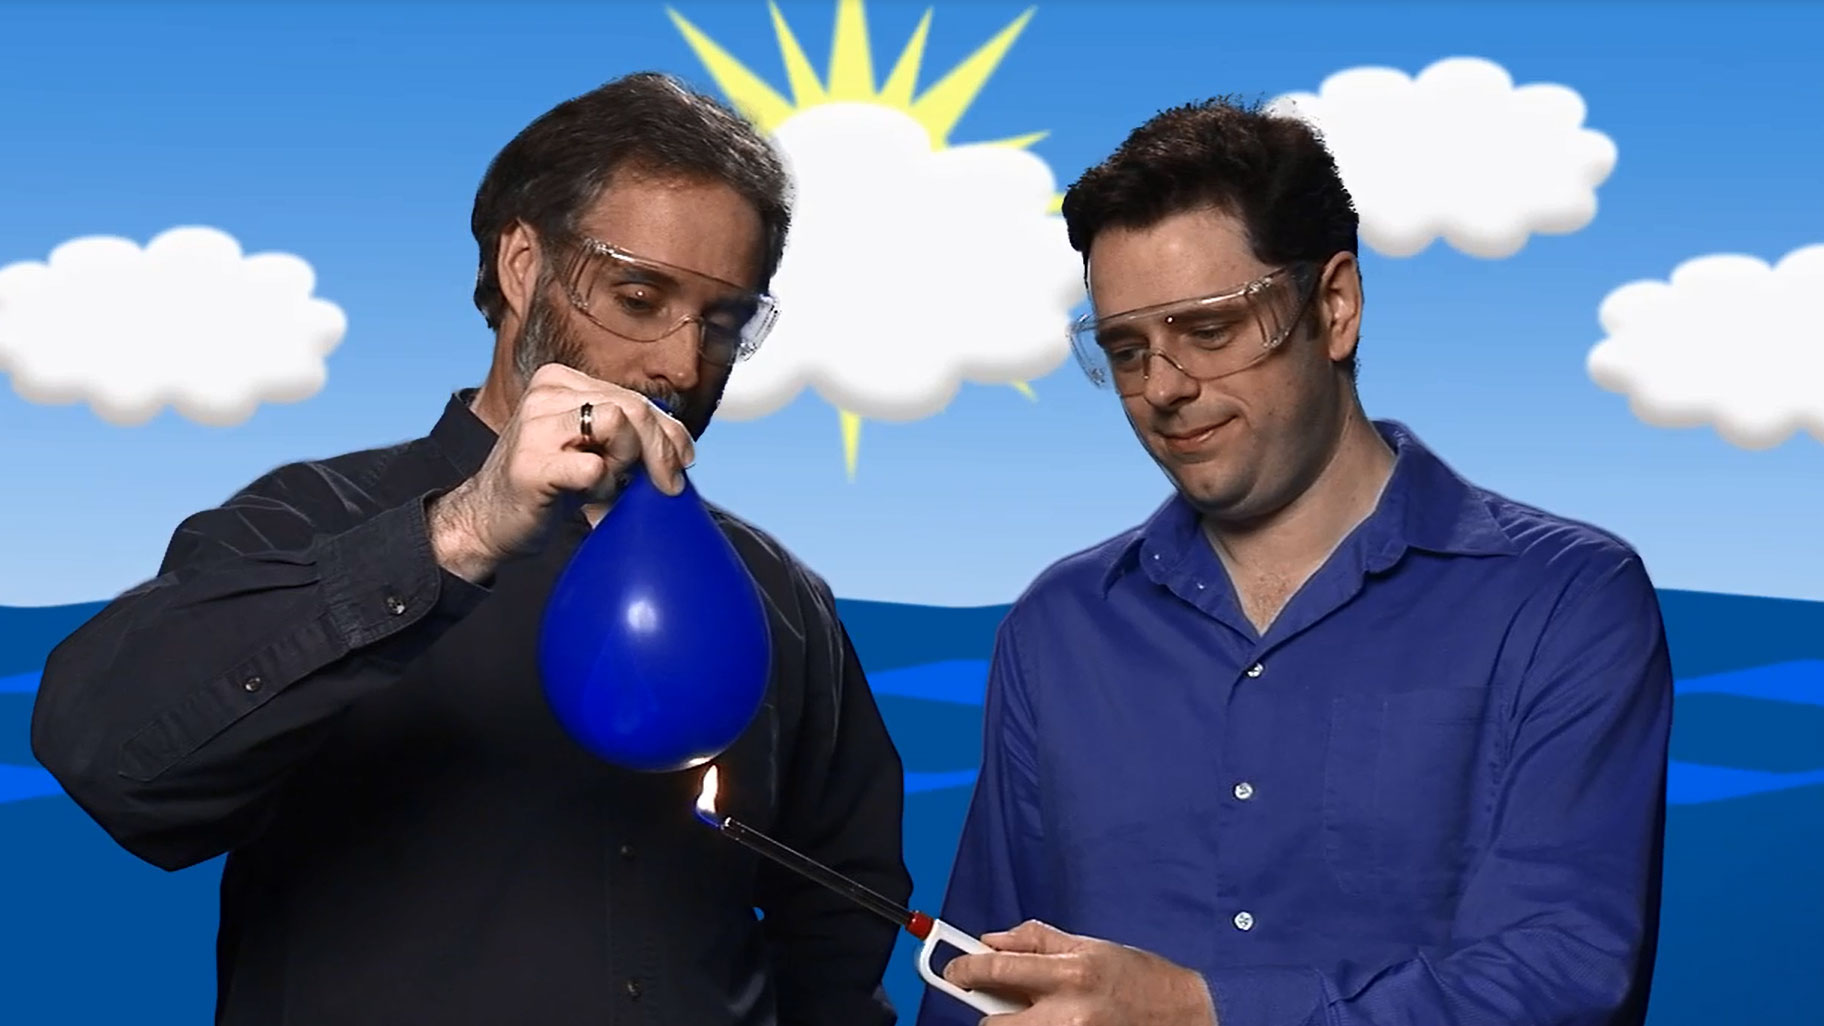
JPL scientist Josh Willis uses a water balloon to show how Earth's oceans are absorbing most of the heat being trapped on our warming world. | › Related lesson
These fine-scale ocean currents also transport nutrients to marine life and circulate pollutants such as crude oil and debris. Understanding nutrient transport helps oceanographers assess ocean health and the productivity of fisheries. And tracking pollutants aids in natural hazard assessment, prediction, and response.
How It Works
A joint effort between NASA and the French space agency – with contributions from the Canadian and UK space agencies – SWOT will continue NASA’s decades-long record of monitoring sea surface height across the globe. But this mission will add a level of detail never before achieved.
SWOT will measure more than 90% of Earth’s surface water, scanning the planet between 78°N latitude and 78°S latitude within 1 centimeter of accuracy and retracing the same path every 21 days. Achieving this level of accuracy from a spacecraft height of 554 miles (891 kilometers) requires that the boom using radar to measure water elevation remain stable within 2 microns – or about 3% of the thickness of a human hair.
This visualization shows ocean surface currents around the world during the period from June 2005 through December 2007. With its new, high resolution wide-swath measurements, SWOT will be able to observe eddies and current features at greater resolution than previously possible. Credit: NASA Scientific Visualization Studio | Watch on YouTube
Prior to SWOT, spacecraft have used conventional nadir, or straight-down, altimetry to measure sea surface height. Conventional nadir altimetry sends a series of radar or laser pulses down to the surface and measures the time it takes for each signal to return to the spacecraft, thus revealing distances to surface features. To acquire more detailed information on surface water, SWOT will use an innovative instrument called the Ka-band Radar Interferometer, or KaRIn, to measure water height with exceptional accuracy. Ka-band is a portion of the microwave part of the electromagnetic spectrum. SWOT uses microwaves because they can penetrate clouds to return data about water surfaces.

SWOT will track Earth's surface water in incredible detail using an innovative instrument called the Ka-band Radar Interferometer, or KaRIn. Image credit: NASA/JPL-Caltech | + Expand image
The KaRIn instrument uses the principles of synthetic aperture radar combined with interferometry to measure sea surface height. A radar signal is emitted from the end of the 10-meter-wide boom on the spacecraft. The reflected signal is then received by antennas on both ends of the boom, capturing data from two 30-mile (50-kilometer) wide swaths on either side of the spacecraft. The received signals will be slightly out of sync, or phase, from one another because they will travel different distances to return to the receivers on either end of the boom. Knowing the phase difference, the distance between the antennas, and the radar wavelength allows us to calculate the distance to the surface.

Radar signals bounced off the water’s surface will be received by antennas on both ends of SWOT's 10-meter-wide boom. The received signals will be slightly out of phase because they will travel different distances as they return to the receivers. Scientists use this phase difference and the radar wavelength to calculate the distance to the surface. Image credit: NASA/JPL-Caltech | + Expand image
The observations acquired by the two antennas can be combined into what is known as an interferogram. An interferogram is a pattern of wave interference that can reveal more detail beyond the 1-centimeter resolution captured by the radar. To explain how it works, we'll recall a couple of concepts from high school physics. When out-of-phase waves from the two antennas are combined, constructive and destructive interference patterns result in some wave crests being higher and some wave troughs being lower than those of the original waves. The patterns that result from the combination of the waves reveal more detail with resolution better than the 1-centimeter wavelength of the original Ka-band radar waves because the interference occurs over a portion of a wavelength. An interferogram can be coupled with elevation data to reveal a 3D representation of the water’s surface.
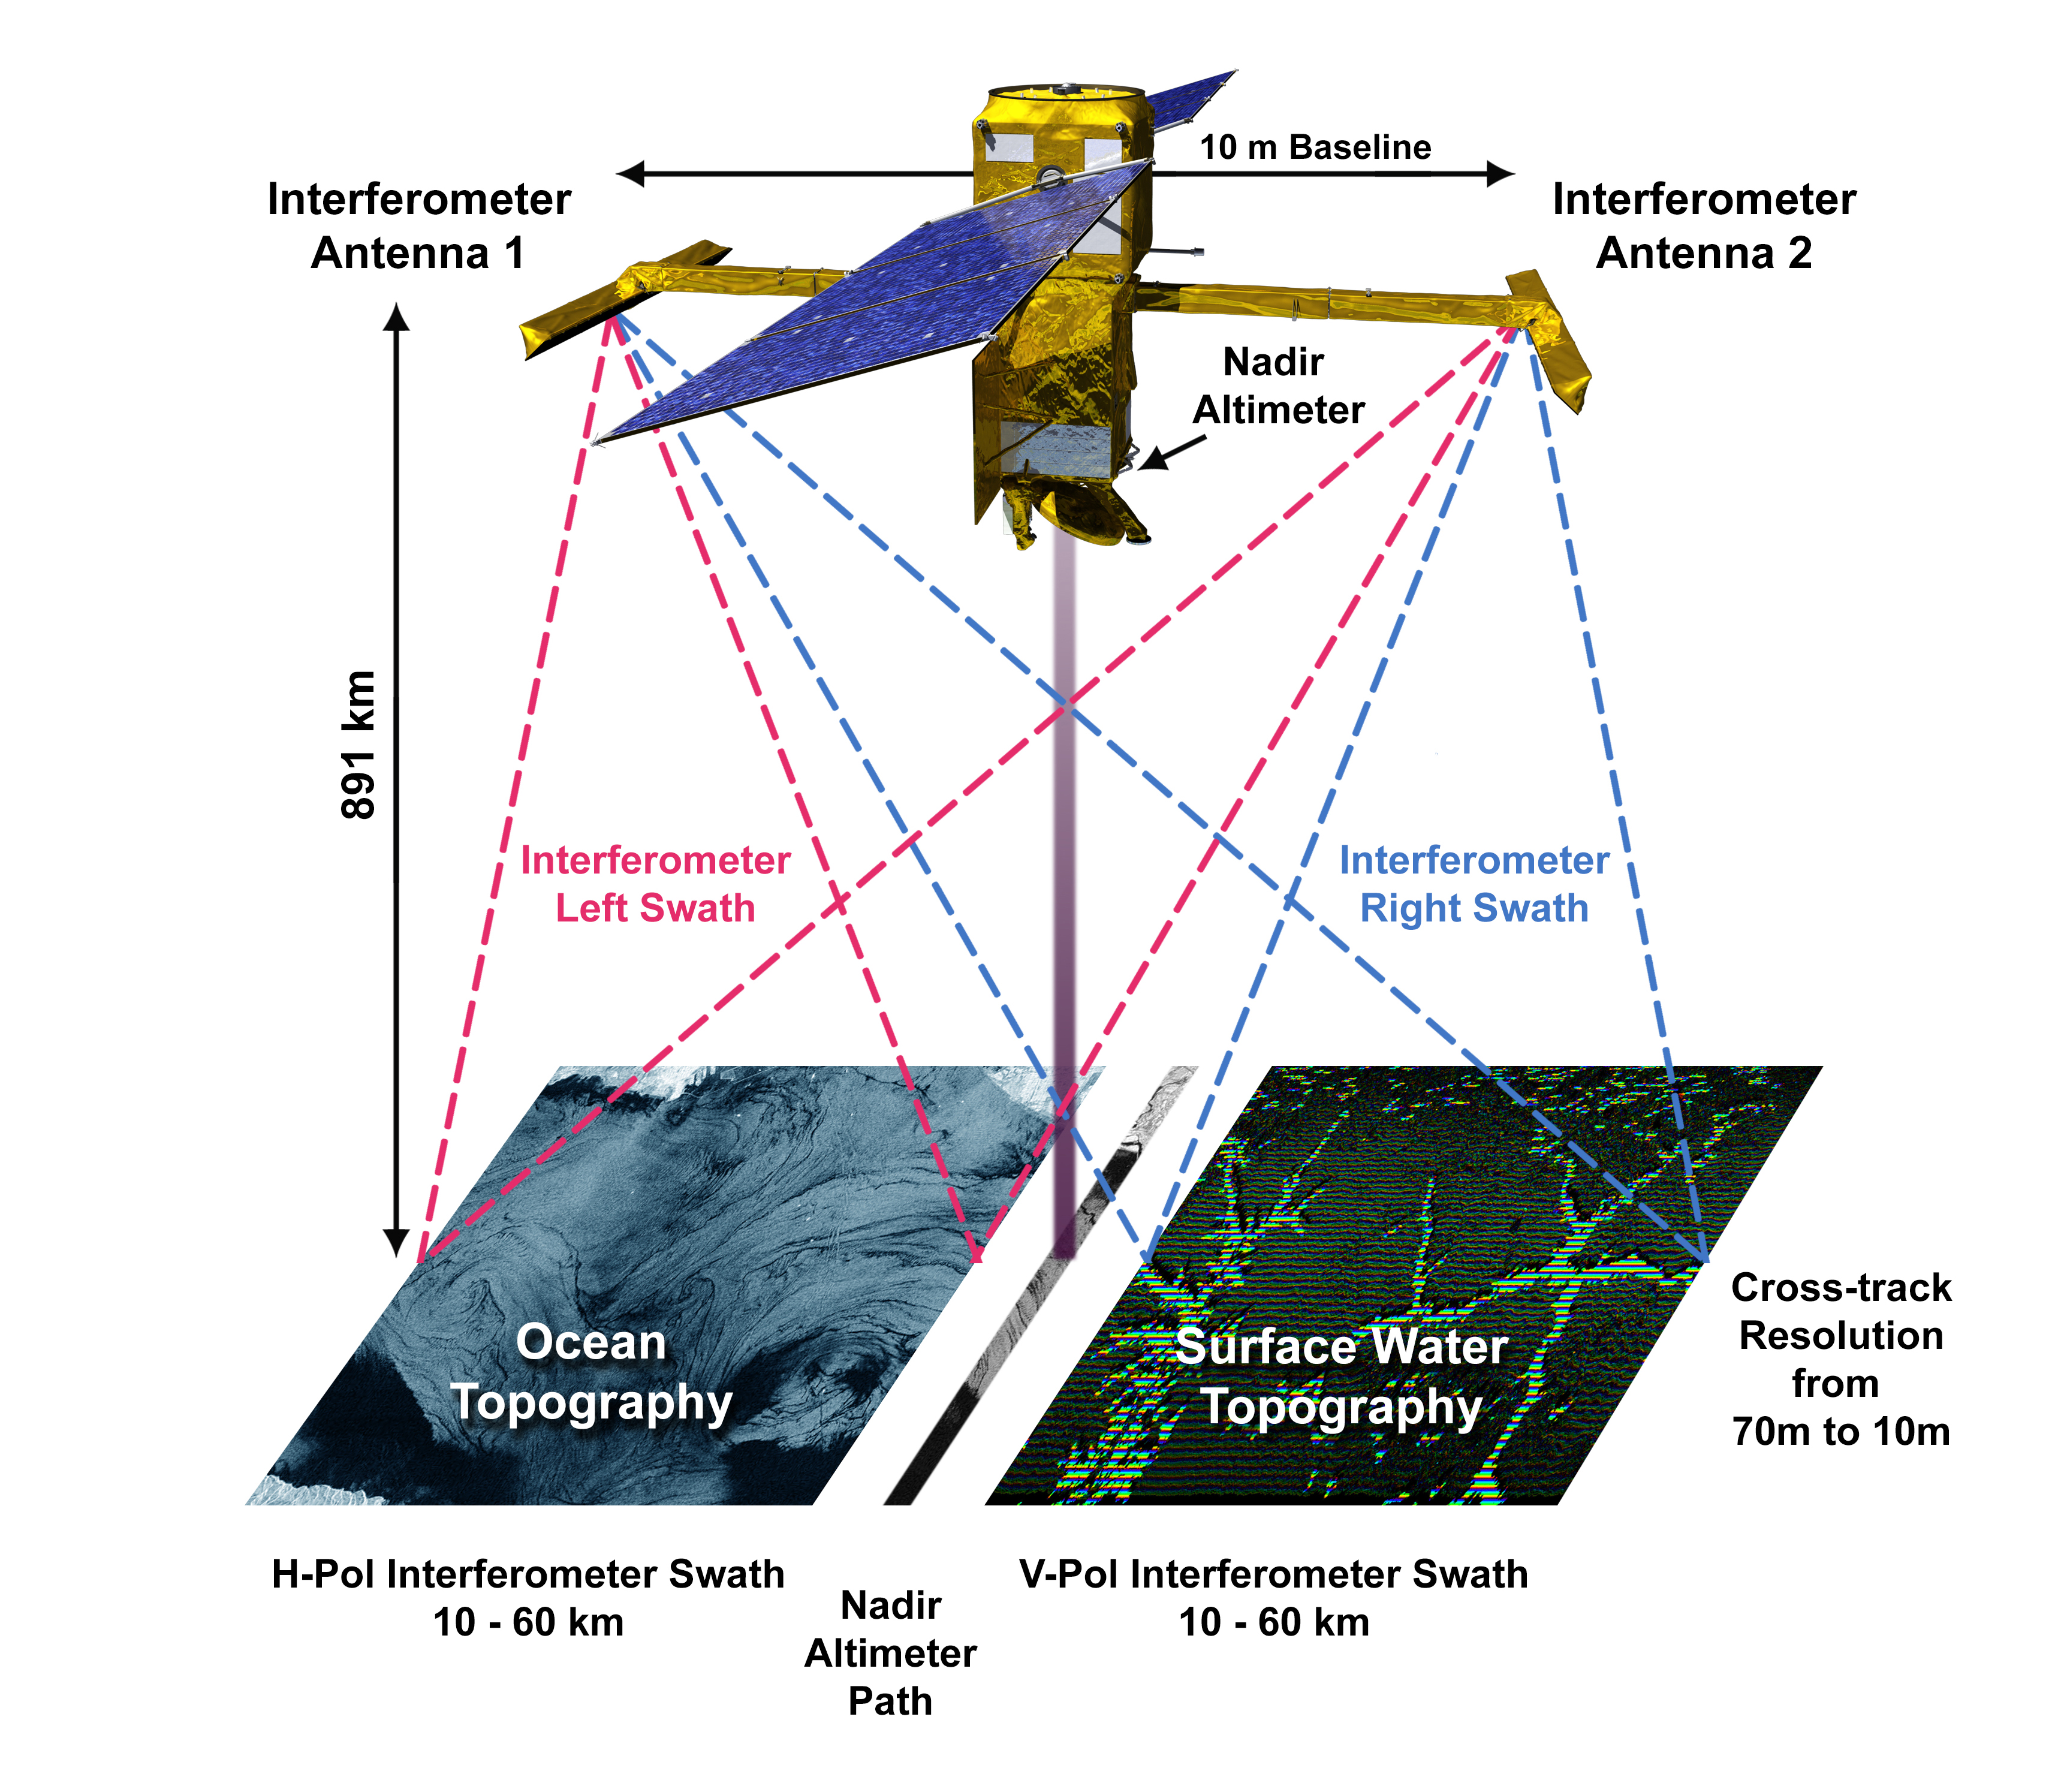
The KaRIn instrument illuminates two parallel tracks of approximately 50 kilometres on either side of a nadir track from a traditional altimeter. The signals are received by two antennas 10 metres apart and are then processed to yield interferometry measurements. Image credit: NASA/JPL-Caltech | + Expand image
This highly accurate 3D view of Earth’s surface water is what makes SWOT so unique and will enable scientists to more closely monitor the dynamics of the water cycle. In addition to observing ocean currents and eddies that will inform our understanding of the ocean’s role in climate change, SWOT's use of interferometry will allow scientists to track volumetric changes in lakes and quantify river flooding, tasks that cannot yet be done on a wide scale in any other way.
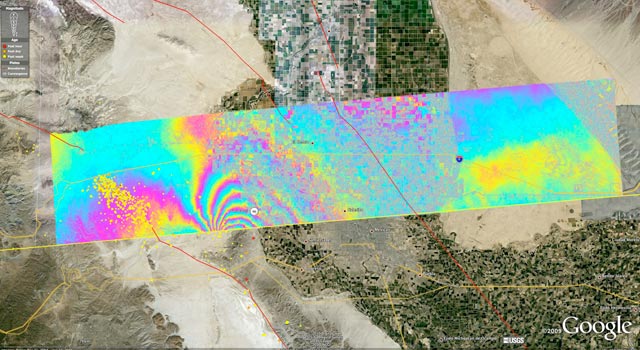
This interferogram was captured by the air-based UAVSAR instrument of the magnitude 7.2 Baja California earthquake of April 4, 2010. The interferogram is overlaid atop a Google Earth image of the region. Image credit: NASA/JPL/USGS/Google | › Learn more
Follow Along
SWOT is scheduled to launch no earlier than Dec. 16, 2022, on a SpaceX Falcon 9 rocket from Vandenberg Space Force Base in California. Tune in to watch the launch on NASA TV.
After launch, the spacecraft will spend 6-months in a calibration and validation phase, during which it will make a full orbit of Earth every day at an altitude of 553 miles (857 kilometers). Upon completion of this phase, SWOT will increase its altitude to 554 miles (891 kilometers) and assume a 21-day repeat orbit for the remainder of its mission.
Visit the mission website to follow along as data are returned and explore the latest news, images, and updates as SWOT provides a new view on one of our planet's most important resources.
Teach It
The SWOT mission is the perfect opportunity to engage students in studying Earth’s water budget and water cycle. Explore these lessons and resources to get students excited about the STEM involved in studying Earth’s water and climate change from space.
Educator Resources
-
 Collection
SWOT Mission Lessons for Educators
Explore the science and engineering behind the SWOT mission with this collection of standards-aligned lessons all about water.
- Collection
Climate Change Lessons for Educators
Explore a collection of standards-aligned STEM lessons for students that get them investigating climate change along with NASA.
- Collection
Teachable Moments in Climate Change
Explore this collection of Teachable Moments articles to get a primer on the latest NASA Earth science missions, plus find related education resources you can deploy right away!
- Expert Talk
Teaching Space With NASA – Monitoring Earth from Space
In this educational talk, NASA experts discuss how we build spacecraft to study climate, then answer audience questions.
Student Activities
-
 Collection
SWOT Mission Activities for Students
Explore projects, videos, slideshows, and games for students all about the water cycle and sea level rise.
- Collection
Climate Change Activities for Students
Learn about climate change and its impacts with these projects, videos, and slideshows for students.
- Collection
Earth Minute Video Series
This series of animated white-board videos for students of all ages explains key concepts about Earth science, missions, and climate change.
Explore More
Activities for Kids
- Download: SWOT Launch Bingo
- Video: How Much Water is on Earth?
- Game: Go With the Flow – An Ocean Currents Game
Websites
- SWOT Mission Website
- NASA Climate Change
- NASA Earth Observatory
- NASA Climate Kids
- NASA Sea Level Change
- NASA Cambio Climático en Español
Facts & Figures
Videos
Interactives
Image Gallery
Articles
- Climate articles from NASA
- Ask NASA Climate
- NASA People - Earth
- Water Mission to Gauge Alaskan Rivers on Front Lines of Climate Change
Podcast
TAGS: K-12 Education, Teachers, Educators, Earth Science, Earth, Climate Change, Climate, Satellites, Teachable Moments, Climate TM

Teachable Moments | May 2, 2022
How NASA Plans to Dig Up the Dirt on Climate Change


Learn about the role that dust plays in Earth's climate, why scientists are interested in studying dust from space, and how to engage students in the science with STEM resources from JPL.
A NASA instrument launched to the International Space Station this summer will explore how dust impacts global temperatures, cloud formation, and the health of our oceans. The Earth Surface Mineral Dust Source Investigation, or EMIT, is the first instrument of its kind, designed to collect measurements from space of some of the most arid regions on Earth to understand the composition of soils that generate dust and the larger role dust plays in climate change.
Read on to find out how the instrument works and why scientists are hoping to learn more about the composition of dust. Then, explore how to bring the science into your classroom with related climate lessons that bridge physical sciences with engineering practices.
Why It’s Important
Scientists have long studied the movements of dust. The fact that dust storms can carry tiny particles great distances was reported in the scientific literature nearly two centuries ago by none other than Charles Darwin as he sailed across the Atlantic on the HMS Beagle. What still remains a mystery all these years later is what that dust is made of, how it moves, and how that affects the health of our planet.
For example, we now know that dust deposited on snow speeds up snow melt even more than increased air temperature. That is to say, that dust traveling to cold places can cause increased snow melt.
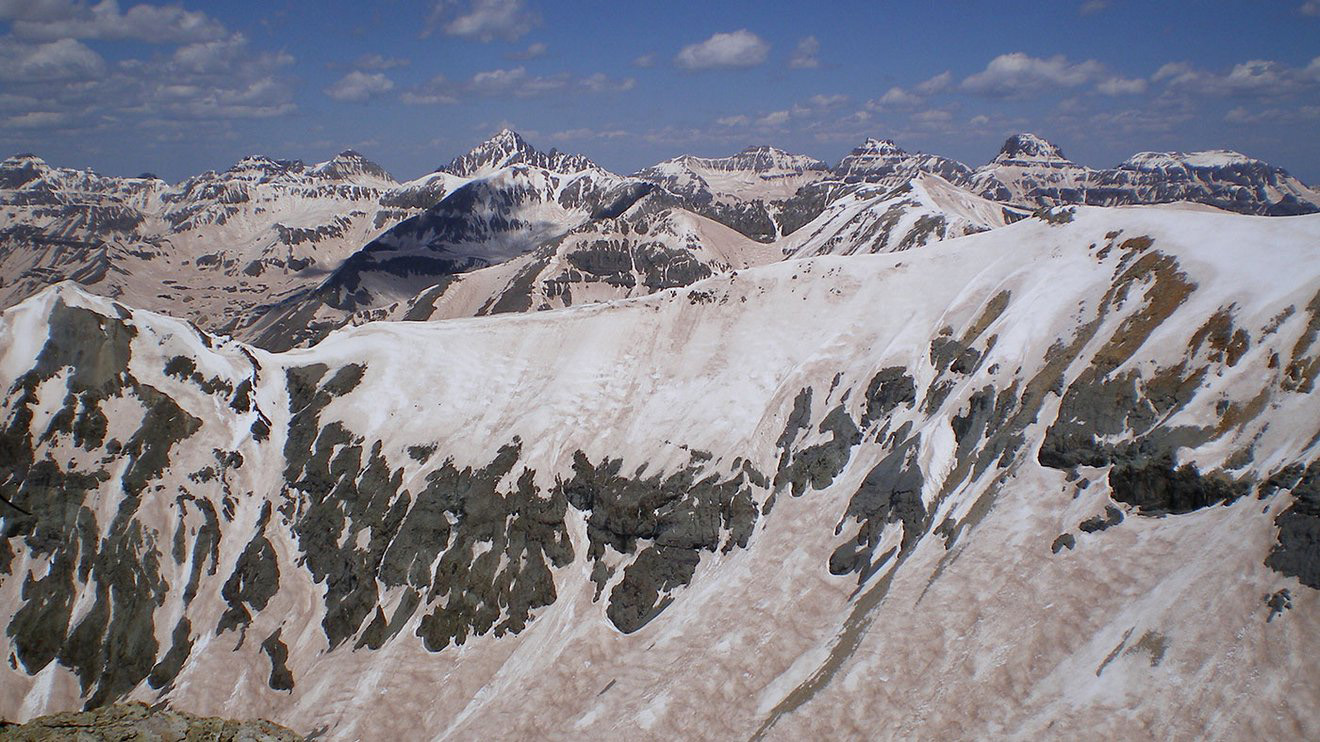
A coating of dust on snow speeds the pace of snowmelt in the spring. Credit: NASA | + Expand image
Dust can affect air temperatures as well. For example, dust with more iron absorbs light and can cause the air to warm, while dust with less iron reflects light and is responsible for local cooling. Iron in dust can also act as a fertilizer for plankton in oceans, supplying them with nutrients needed for growth and reproduction.

A plume of dust is shown emanating from over Alaska's Copper River in October 2016 in these images captured by the Moderate Resolution Imaging Spectroradiometer, or MODIS, instrument on NASA’s Terra and Aqua satellites. Dust storms play a key role in fueling phytoplankton blooms by delivering iron to the Gulf of Alaska. Credit: NASA | › Full image and caption
Floating dust potentially alters the composition of clouds and how quickly or slowly they form, which can ultimately impact weather patterns, including the formation of hurricanes. That’s because clouds need particles to act as seeds around which droplets of moisture in the atmosphere can form. This process of coalescing water particles, called nucleation, is one factor in how clouds form.
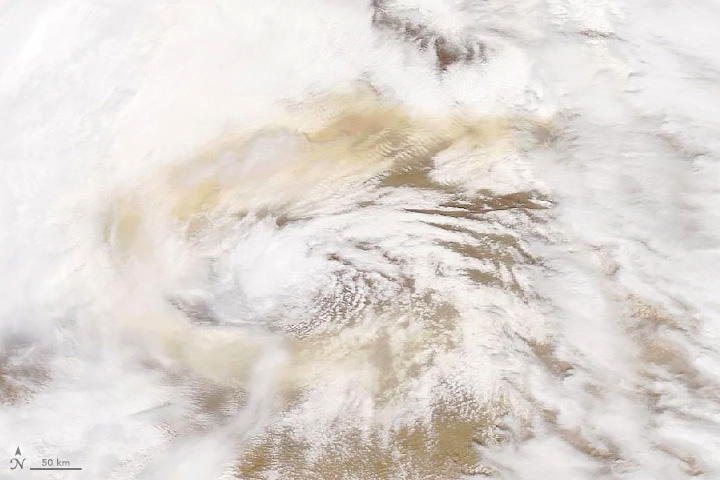
A swirl of dust mixes with the clouds in a low-pressure storm over the Gobi desert between Mongolia and China. This image was captured by the MODIS instrument on the Terra satellite in May 2019. Credit: NASA | › Full image and caption
Thanks to EMIT, we’ll take the first steps in understanding how the movements of dust particles contribute to local and global changes in climate by producing “mineral maps”. These mineral maps will reveal differences in the chemical makeup of dust, providing essential information to help us model the way dust can transform Earth’s climate.
› Learn more about what EMIT will do from JPL News
How It Works
NASA has been exploring how dust moves across the globe by combining on-the-ground field studies with cutting-edge technology.
Dr. Olga Kalashnikova, an aerosol scientist at NASA's Jet Propulsion Laboratory and a co-investigator for EMIT, has been using satellite data to study atmospheric mineral dust for many years, including tracking the movements of dust and investigating trends in the frequency of dust storms.
As Dr. Kalashnikova describes, “From the ground, we can see what types of dusts are lifted into the atmosphere by dust storms on a local scale, but with EMIT, we can understand how they differ and where they originally came from.”
EMIT is the first instrument designed to observe a key part of the mineral dust cycle from space, allowing scientists to track different dust compositions on a global scale, instead of in just one region at a time. To understand dust’s impact on Earth’s climate, scientists will use EMIT to answer key questions, including:
- How does dust uplifted in the atmosphere alter global temperatures?
- What role do dusts play in fertilizing our oceans when they are deposited?
- How do dust particles in the atmosphere affect cloud nucleation; the process by which clouds are ‘seeded’ and begin to coalesce into larger clouds?

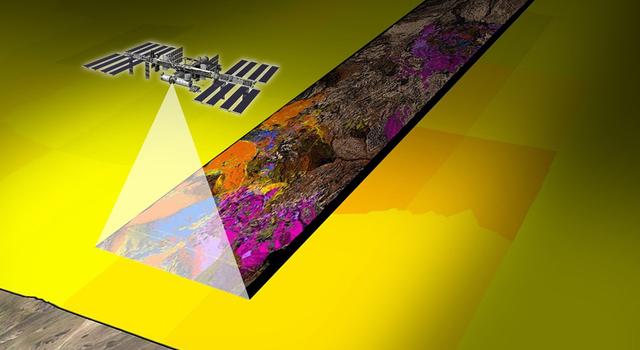
The EMIT instrument will fly aboard the International Space Station, which orbits Earth about once every 90 minutes, completing about 16 orbits per day. Credit: NASA | + Expand image
To achieve its objectives, EMIT will spend 12 months collecting what are called “hyperspectral images” of some of the most arid regions of our planet selected by scientists and engineers as areas of high dust mobility, such as Northern Africa, the Middle East, and the American Southwest.
These images are measurements of light reflected from the Earth below, calibrated to the distinct patterns, or spectra, of light we see when certain minerals are present. The EMIT team has identified 10 minerals that are most common, including gypsum, hematite, and kaolinite.
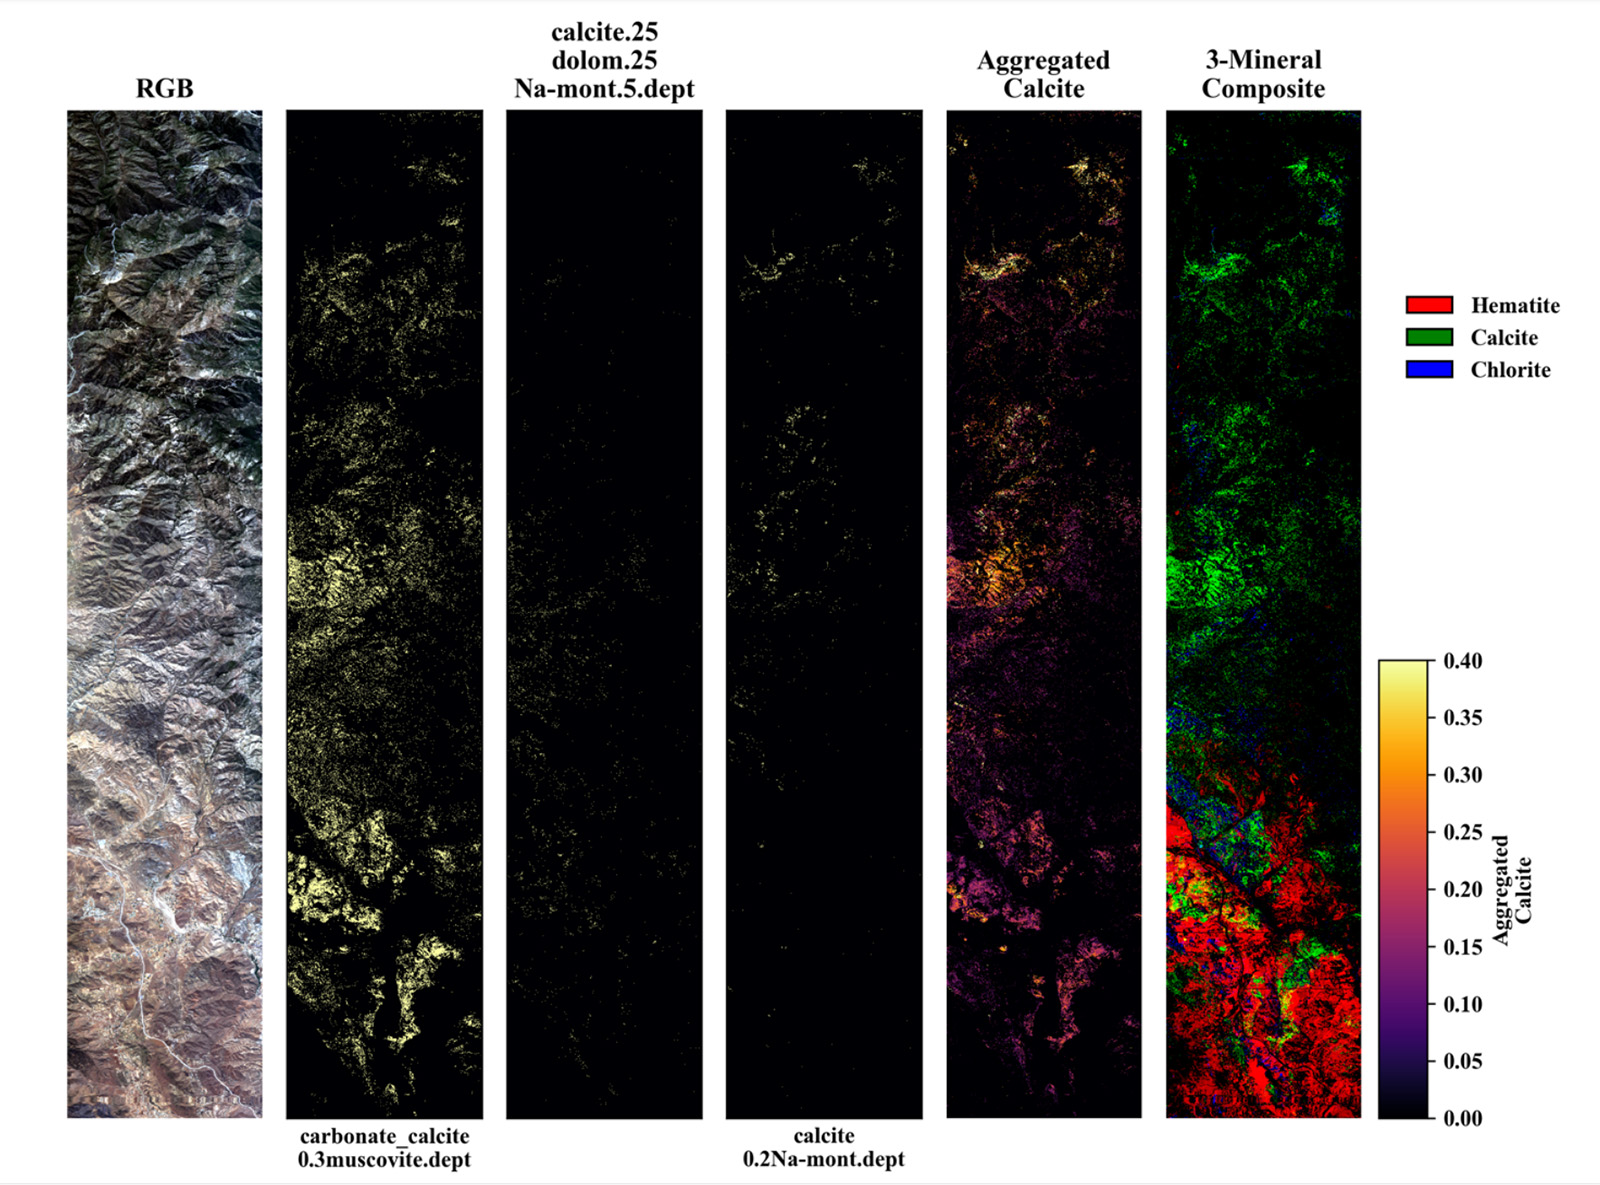
This example spectra shows how scientists will be able to identify different concentrations of minerals and elements in data collected by EMIT. Credit: NASA/JPL-Caltech | + Expand image
Why are these minerals important? One key reason is the presence or absence of the element iron, found in some minerals but not others.
Dr. Bethany Ehlmann is a planetary scientist and co-investigator for the EMIT project at Caltech and explains that when it comes to heating, “a little bit of iron goes a long way.” Iron in minerals absorbs visible and infrared light, meaning that even if only a small amount is present, it will result in a much warmer dust particle. Large amounts of warm dust in our atmosphere may have an impact on temperatures globally since those dust particles radiate heat as they travel, sometimes as far as across oceans!
Collecting images from space is, of course, no easy task, especially when trying to look only at the ground below. Yet it does allow scientists to get a global picture that's not possible to capture from the ground. Field studies allow us to take individual samples from tiny places of interest, but from space, we can scan the entire planet in remote places where no scientist can visit.
Of course, there are some complications in trying to study the light reflected off the surface of Earth, such as interference from clouds. To prevent this problem, the EMIT team plans to collect data at each location several times to ensure that the images aren’t being obscured by clouds between the instrument and the minerals we’re looking for.
The data collected by EMIT will provide a map of the compositions of dust from dry, desert environments all over the world, but the team involved won’t stop there. Knowing more about what the dust is made of sets the stage for a broader understanding of a few more of the complex processes that make up our global climate cycle. Upon completion of this study, EMIT's mineral maps will support further campaigns to complete our global dust picture. For example, NASA hopes to couple the data from EMIT with targeted field campaigns, in which scientists can collect wind-blown dust from the ground to learn more about where dust particles move over time and answer questions about what types of dust are on the go.
Furthermore, missions such as the Multiangle Imager for Aerosols, or MAIA, will allow us to better understand the effects of these dust particles on air-quality and public health.
Teach it
Studying Earth’s climate is a complex puzzle, consisting of many trackable features. These can range from sea level to particles in our atmosphere, but each makes a contribution to measuring the health of our planet. Bring EMIT and NASA Earth Science into your classroom with these lessons, articles, and activities to better understand how we’re exploring climate change.
Educator Guides
-
Ocean World: Earth Globe Toss Game
Students use NASA images and a hands-on activity to compare the amounts of land and surface water on our planet.
Subject Science
Grades K-6
Time Less than 30 mins
-
Modeling the Water Budget
Students use a spreadsheet model to understand droughts and the movement of water in the water cycle.
Subject Science
Grades 5-8
Time 30-60 mins
-
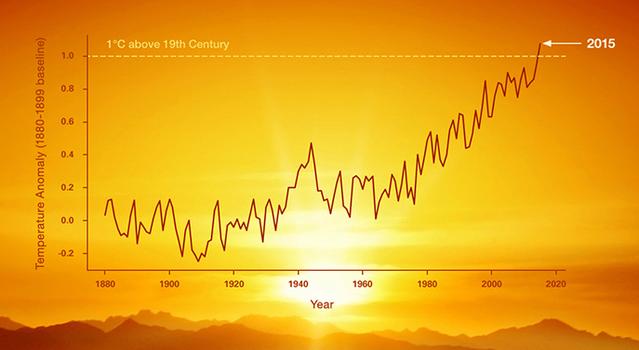
Graphing Global Temperature Trends
Students use global temperature data to create models and compare short-term trends to long-term trends.
Subject Math
Grades 5-12
Time 1-2 hrs
-
Using Light to Study Planets
Students build a spectrometer using basic materials as a model for how NASA uses spectroscopy to determine the nature of elements found on Earth and other planets.
Subject Science
Grades 6-11
Time > 2 hrs
-

Cloud Computing: A 'Pi in the Sky' Math Challenge
In this illustrated math problem, students use pi to calculate how much water could be contained within a cloud.
Subject Math
Grades 6-12
Time Less than 30 mins
-
More Earth Science Lessons for Educators
Explore a collection of standards-aligned STEM lessons for students that get them investigating Earth science along with NASA.
Student Activities
-
The Types of Clouds and What They Mean
Learn about cloud types and how they form. Then help NASA scientists studying clouds.
Subject Science
Grades K-3
Time 30-60 mins
-
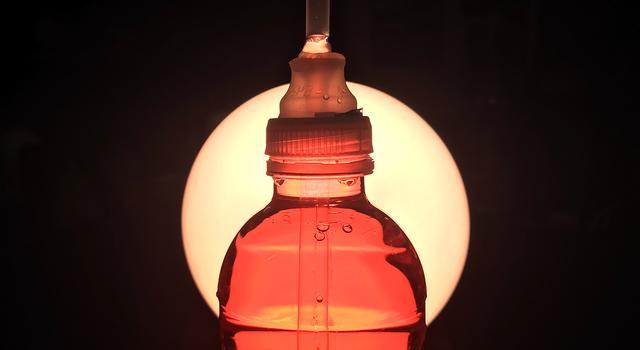
Make a Cloud in a Bottle
Have you ever wondered how clouds form? In this activity, you can make your own cloud to see for yourself!
Subject Science
Grades 4-12
Time < 30 mins
-
Video Series: NASA's Earth Minute
Learn about the science behind climate change and the NASA missions studying it in these short videos.
Subject Science
Grades 2-12
Time < 30 mins
-
The Change of Seasons: Views from Space
See how seasonal changes affect our planet.
Subject Science
Grades 2-12
Time < 30 mins
-
More Earth Science Activities for Students
Explore Earth science with these projects, videos, and slideshows for students.
Articles
-
 Teachable Moments
Reflecting On Greenland’s Melting Glaciers as OMG Mission Concludes
Explore how the OMG mission discovered more about what's behind one of the largest contributors to global sea level rise.
-
 Teachable Moments
Earth Satellite Joins NASA Fleet to Monitor Sea Level, Improve Weather Forecasts
Learn about the mission and find out how to make classroom connections to NASA Earth science – plus explore related teaching and learning resources.
- Teachable Moments
Climate Change Collection
Explore this collection of Teachable Moments articles to get a primer on the latest NASA Earth science missions, plus find related education resources you can deploy right away!
Websites
- NASA Climate Change
- NASA Earth Observatory - Images of Dust and Haze
- NASA Climate Kids
- Recursos En Español: NASA Climate Change
TAGS: Earth, climate, geology, weather, EMIT, Teachers, Classroom, Lessons, Earth Science, Climate Change, Dust, Global Warming, Educators, K-12, Teachable Moments, Climate TM
Meet JPL Interns | March 22, 2022
The JPL Interns Protecting Earth's Future

We went behind the scenes with three interns on NASA’s Earth System Observatory team to learn how they're devoting their future careers to putting our planet first.
Leave it to the interns at NASA's Jet Propulsion Laboratory to school the full-timers. Case in point: JPL intern Joalda Morancy knows exactly how to explain—in bite-sized, plain English—NASA’s latest multi-missioned initiative to study our home planet.
“The Earth System Observatory aims to tackle one of the biggest issues we’re facing today—climate change,” they say of NASA's ESO. “We need to have multiple missions that look at the Earth system as a whole in order to tackle the issue of climate change in the next couple of decades.”
The observatory will be made up of an array of satellites, instruments, and missions to form a well-rounded collection of observations meant to offer crucial and precise measurements of our environment. As NASA puts it: “Taken together, as a single observatory, we will have a holistic, 3-dimensional understanding of our Earth’s systems—how they work together, how one change can influence another.”
While the ESO is in its early stages, it’s a crucial time for interns to be involved, as their generation will most likely face the most pressing challenges resulting from climate change. We spoke to three JPL interns getting first-hand experience with the observatory's missions and projects to learn why, to them, Earth is the most important planet to study right now.
Joalda Morancy
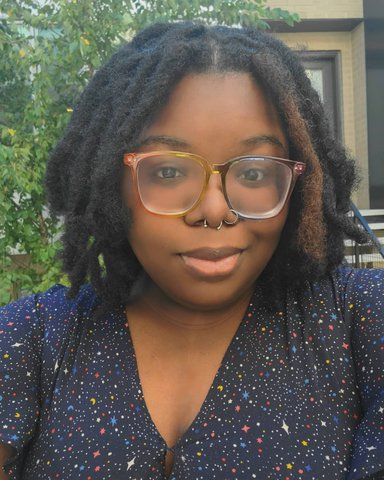
Image courtesy: Joalda Morancy | + Expand image
Morancy first became fascinated by space exploration in high school thanks to a YouTube video on how to make a peanut butter and honey sandwich in space.
“I love telling that story,” Morancy says with a laugh. “It was so random, and I was so intrigued. I watched the entire video and thought, ‘This is amazing.’ I did a lot more research about what NASA does and that was my gateway to space.”
Flash forward a few years to college at the University of Chicago, where Morancy discovered there was one planet in particular that really captured their attention: Earth.
“I was initially interested in space exploration, and while [majoring in] astrophysics, I took a class on what makes a planet habitable,” they recall. “It taught me everything about basic Earth sciences and how that ties into Earth and the big picture of how a habitable environment operates.”
Morancy found it so interesting and—combined with their growing alarm about climate change—wanted a hand in studying how to preserve our planet. So Morancy took more classes in geophysics and geophysical sciences, including courses on atmosphere, glaciology, and physical geology.
“I wanted to give myself the foundational knowledge,” Morancy says. “And right after that, I started at JPL.”
They had originally searched JPL’s careers site for internships with the Perseverance Mars rover mission but noticed an opening with the Earth Science team.
“I didn’t know JPL did Earth science; I thought it was mostly Mars and robotic exploration,” they say. “When I saw that opening, I knew it was the perfect opportunity for me to learn more about Earth.”
For the past year-and-a-half, Morancy has worked on ECOSTRESS, an ESO-related experiment aboard the International Space Station designed to measure water stress among plants. Now, they are interning with the ESO successor to ECOSTRESS, the Surface Biology and Geology, or SBG, mission.
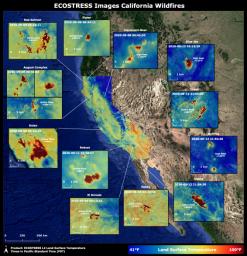
A graphic developed by Morancy during their internship with the ECOSTRESS mission shows the land surface temperatures at different locations throughout California. Image credit: NASA/JPL-Caltech | › Full image and caption
“I help with a lot of project management since SBG is in its early stages,” they say. “A lot of things are starting to cook up, and a lot of engineers and scientists are being onboarded to the team. I’m working with the team to help onboard, and I’m also helping with the science instruments for SBG.”
The magnitude of being part of SBG and the observatory team in their early stages is not lost on Morancy.
“I really believe it will have a long-lasting impact on how we look at climate change and how we target those specific issues to fix,” they say. “It'll be a major driver for future researchers and scientists.”
While Morancy hopes to combine Earth sciences and space exploration for their future career, they’re invested in studying our blue planet for the long run.
“I think Earth science is incredibly important because this is our only home,” they say. “Even though people are looking to settle on Mars and other celestial bodies ... I think it’s important to take care of this rock we’ve been given to live on. It’s crucial to make sure we take care of it for future generations.”
Rebecca Gustine
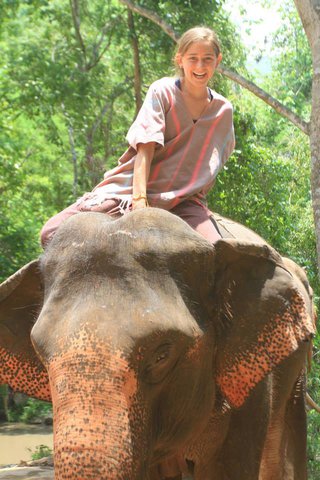
Image courtesy: Rebecca Gustine | + Expand image
When Rebecca Gustine studied abroad in Thailand during her junior year of college, she didn’t realize it would alter the course of her studies and her future career path.
“I had a lightbulb moment realizing how human development and access to water go hand in hand,” she says.
Gustine went on to Washington State University, where she is now a Ph.D. student studying civil engineering with a focus on water resources engineering.
“A lot of my undergraduate research had to do with water,” she explains. “It was from a global health perspective and had to do with access to clean water, hygiene, and gender dynamics in developing countries. I also really like math and physics, so combining global health with water resources engineering was very interesting.”
Gustine was so fascinated by water research, she knew she wanted to find an internship that would let her focus on just that. When she saw an open call for internships at JPL, she submitted her resume and was contacted by Gregory Halverson and Christine Lee, JPL scientists focused on using remote sensing measurements to study water quality, water resources, and ecosystems management.
Gustine started at JPL as an intern in August 2020, supporting the Earth science team by looking at how ECOSTRESS data could be used to preserve habitats in the California Bay Delta system, where the Sacramento and the San Joaquin Rivers meet. For the past year, she has focused on processing remote-sensing data and engaging with stakeholders. She was even first-author on a peer-reviewed paper.
“My work is basically using pictures [taken] from the sky that tell us information about the Earth and then making decisions about how to manage water resources and protect critical habitats,” she says.
Gustine is also well aware that her research comes at a pivotal time in the global conversation around Earth’s future.
“Given that climate change is having a profound impact on human and natural systems, we have to understand those changes and protect critical habitats and resources for the well-being of humans everywhere,” she says. “Changes in one component of a system can have cascading consequences for other parts of the system.”
While she works alongside others exploring the mysteries of worlds beyond Earth, Gustine is particularly proud to be part of pioneering research that could alter the future of our planet.
“Observing Earth is still space exploration, just from a different vantage point,” she says. “Given that NASA is the major proprietor of space, to look back at Earth using the same technology we use to go farther into space is important.”
Jonathan Vellanoweth
Image courtesy: Jonathan Vellanoweth | + Expand image
What will be the future, long-term impacts of power plants on our environment? Jonathan Vellanoweth is spending his time as a JPL intern working with a team to try to help answer that very question.
Vellanoweth is a student at Cal State University, Los Angeles, where he’s earning his master’s degree in environmental science with an emphasis in geospatial science. In his internship with the Surface Biology and Geology team at JPL, he's using data and satellite imagery from ECOSTRESS and the Landsat mission to detect thermal plumes emitted by power plants.
Vellanoweth’s work currently focuses on the Diablo Canyon Power Plant in San Luis Obispo, California.
“We’re looking at power plants that intake coastal waters to cool their reactors, then discharge it at a higher temperature back into the same water body,” he explains. “I’m using satellite imagery to detect that thermal change and outline the area of what is classified as a plume, or anywhere thermal discharge is heating up the ocean or the coast. We can see where this plume is moving over the year or several seasons, and other studies can use this data to see what the actual effects are on coastal communities.”
Vellanoweth has been fascinated by Earth science since as early as 7th grade, when he took his first environmental science class where he learned all about the scientific method and later went out into nature to collect soil samples and study them.
As a JPL intern, Vellanoweth has been particularly grateful for the variety of knowledge his colleagues provide him.
“The amount of support that you have from all these great scientists that work here is really what attracted me,” he says. “You can intern for a lot of places, but at JPL, you have all these colleagues you can meet with who have a lot of feedback they can give you. There are people on your team studying similar and dissimilar things as you, so they can provide you with something you might not have thought about and help expand your research.”
Most importantly, Vellanoweth is looking forward to the information everyone will have access to in the future thanks to the efforts of all the missions and projects within the Earth Science Observatory.
“I’m excited about getting things out there and making them accessible to the public. I’m really big on that because there are a lot of people who want to do this kind of research, but a lot of times, it can be hard to find the data or algorithm you need, and it’s a lot of trial and error,” he says. “SBG and ESO bring all of these things together and make it available for everyone.”
The laboratory’s STEM internship and fellowship programs are managed by the JPL Education Office. Extending the NASA Office of STEM Engagement’s reach, JPL Education seeks to create the next generation of scientists, engineers, technologists and space explorers by supporting educators and bringing the excitement of NASA missions and science to learners of all ages.
Career opportunities in STEM and beyond can be found online at jpl.jobs. Learn more about careers and life at JPL on LinkedIn and by following @nasajplcareers on Instagram.
TAGS: Interns, Colleges, Universities, Students, Higher Education, Internships, Student Programs, Year-Round Internship Program, Summer Internship Program, Earth Science, Earth, Climate Change, Earth System Observatory

Teachable Moments | January 24, 2022
Reflecting On Greenland’s Melting Glaciers as OMG Mission Concludes
Explore how the OMG mission discovered more about what's behind one of the largest contributors to global sea level rise. Plus, learn what it means for communities around the world and how to get students engaged.
After six years investigating the effects of warming oceans on Greenland's ice sheet, the Oceans Melting Greenland, or OMG, mission has concluded. This airborne and seaborne mission studied how our oceans are warming and determined that ocean water is melting Greenland’s glaciers as much as warm air is melting them from above.
Read on to learn more about how OMG accomplished its goals and the implications of what we learned. Then, explore educational resources to engage students in the science of this eye-opening mission.
Why It's Important
Global sea level rise is one of the major environmental challenges of the 21st century. As oceans rise, water encroaches on land, affecting populations that live along shorelines. Around the world – including U.S. regions along the Gulf of Mexico and Eastern Seaboard and in Alaska – residents are feeling the impact of rising seas. Additionally, freshwater supplies are being threatened by encroaching saltwater from rising seas.
Sea level rise is mostly caused by melting land ice (primarily glaciers), which adds water to the ocean, as well as thermal expansion, the increase in volume that occurs when water heats up. Both ice melt and thermal expansion result from rising global average temperatures on land and in the sea – one facet of climate change.
This short video explains why Greenland's ice sheets are melting and what it means for our planet. Credit: NASA/JPL-Caltech | Watch more from the Earth Minute series
Greenland’s melting glaciers contribute more freshwater to sea level rise than any other source, which is why the OMG mission set out to better understand the mechanisms behind this melting.
How We Did It
The OMG mission used a variety of instruments onboard airplanes and ships to map the ocean floor, measure the behemoth Greenland glaciers, and track nearby water temperature patterns.
Join JPL scientist Josh Willis as he and the NASA Oceans Melting Greenland (OMG) team work to understand the role that ocean water plays in melting Greenland’s glaciers. Credit: NASA/JPL-Caltech | Watch on YouTube

This animation shows how the OMG mission created a map of the ocean floor, known as a bathymetric map, to determine the geometry around Greenland's glaciers. Image credit: NASA/JPL-Caltech | + Expand image

This animation shows how the OMG mission used radar to measure changes in the thickness and retreat of Greenland's glaciers as well as probes to measure ocean temperature and salinity. Credit: NASA/JPL-Caltech | + Expand image
Early on, the mission team created a map of the ocean floor, known as a bathymetric map, by combining multibeam sonar surveys taken from ships and gravity measurements taken from airplanes. Interactions among glaciers and warming seas are highly dependent on the geometry of the ocean floor. For example, continental shelf troughs carved by glaciers allow pathways for water to interact with glacial ice. So understanding Greenland's local bathymetry was crucial to OMG's mission.
To locate the edges of Greenland's glaciers and measure their heights, the mission used a radar instrument known as the Glacier and Ice Surface Topography Interferometer. Every spring during the six-year OMG mission, the radar was deployed on NASA’s Gulfstream III airplane that flew numerous paths over Greenland’s more than 220 glaciers. Data from the instrument allowed scientists to determine how the thickness and area of the glaciers are changing over time.
Finally, to measure ocean temperature and salinity patterns, scientists deployed numerous cylindrical probes. These probes dropped from an airplane and fell through the water, taking measurements from the surface all the way to the ocean floor. Each probe relayed its information back to computers onboard the plane where ocean temperatures and salinity were mapped. Then, scientists took this data back to their laboratories and analyzed it for trends, determining temperature variations and circulation patterns.
What We Discovered
Prior to the OMG mission, scientists knew that warming air melted glaciers from above, like an ice cube on a hot day. However, glaciers also flow toward the ocean and break off into icebergs in a process called calving. Scientists had the suspicion that warmer ocean waters were melting the glaciers from below, causing them to break off more icebergs and add to rising seas. It wasn’t until they acquired the data from OMG, that they discovered the grim truth: Glaciers are melting from above and below, and warming oceans are having a significant effect on glacial melt.
This narrated animation shows warm ocean water is melting glaciers from below, causing their edges to break off in a process called calving. Credit: NASA | Watch on YouTube
What this means for our Earth's climate is that as we continue burning fossil fuels and contributing to greenhouse gas accumulation, the oceans, which store more than 90% of the heat that is trapped by greenhouse gases, will continue to warm, causing glaciers to melt faster than ever. As warming ocean water moves against glaciers, it eats away at their base, causing the ice above to break off. In other words, calving rates increase and sea level rises even faster.
Our oceans control our climate and affect our everyday lives, whether or not we live near them. With the pace of the melt increasing, our shorelines and nearby communities will be in trouble sooner than previously expected. And it’s not just the beaches that will be affected. If Greenland’s glaciers all melt, global sea levels will rise by over 24 feet (7.4 meters), bringing dramatic change to the landscapes of major cities around the world.
Teach It
Check out these resources to bring the real-life STEM behind the mission into your teaching. With lessons for educators and student projects, engage students in learning about the OMG mission and NASA climate science.
Educator Guides
-
Melting Ice Experiment
Students make predictions and observations about how ice will melt in different conditions then compare their predictions to results as they make connections to melting glaciers.
Subject Science
Grades 2-12
Time 30-60 mins
-
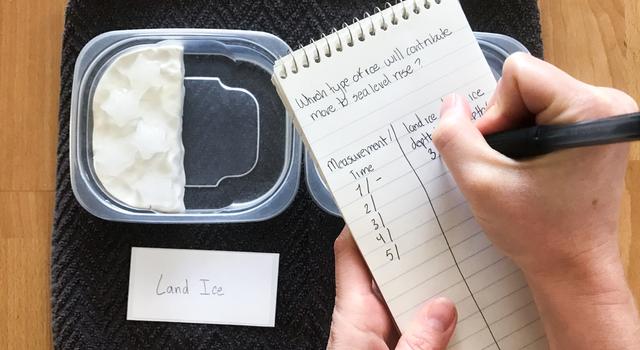
What's Causing Sea-Level Rise? Land Ice Vs. Sea Ice
Students learn the difference between land ice and sea ice and make a model to see how the melting of each impacts global sea level.
Subject Science
Grades 2-8
Time 30-60 mins
-
Lessons in Sea-Level Rise
What is sea-level rise and how does it affect us? This "Teachable Moment" looks at the science behind sea-level rise and offers lessons and tools for teaching students about this important climate topic.
Subject Science
Grades 5-12
Time 30-60 mins
-
Collection: Climate Change Lessons for Educators
Explore a collection of standards-aligned STEM lessons for students that get them investigating climate change along with NASA.
Student Projects
-
How Melting Ice Causes Sea Level Rise
Learn the difference between land ice and sea ice, then do an experiment to see how the melting of each contributes to global sea level rise.
Subject Science
Grades 2-8
Time 30-60 mins
-
Collection: Climate Change Activities for Students
Learn about climate change and its impacts with these projects, videos, and slideshows for students.
Articles

Explore More
Websites
- NASA Climate Change
- NASA Earth Observatory
- NASA Climate Kids
- OMG Mission Website
- NASA Sea Level Change
- NASA Cambio Climático en Español
Facts & Figures
Videos
Interactives
Image Gallery
Articles
- Climate articles from NASA
- Ask NASA Climate
- NASA People - Josh Willis, Principal Investigator, Oceans Melting Greenland
- NASA People - Earth
Podcast
TAGS: Teachable Moment, Climate, Earth Science, Glaciers, Greenland, Ice, Sea Level Rise, Teachers, Educators, Parents, Lessons, Missions, Earth, Climate TM
Edu News | September 9, 2021
JPL Internship Program Expanding Diversity in STEM

Five years in, a JPL initiative forging relationships with students and faculty at historically Black colleges and universities continues expanding its reach, hosting 48 interns this year.
Brandon Ethridge, a flight systems engineer at NASA’s Jet Propulsion Laboratory in Southern California, has had a year to remember. The 24-year-old got engaged, became a father, and is celebrating the one-year anniversary of starting full time at JPL – his self-described dream job.
“Definitely the most eventful year of my life,” Ethridge said.
Brandon Ethridge poses in front of the Mechanical Design Center at JPL during his internship in 2019. Image credit: NASA/JPL-Caltech/Kim Orr | + Expand image
While he’s been gaining experience testing systems used to build spacecraft, Ethridge has spent minimal time at the Laboratory due to the pandemic. But the North Carolina native already had plenty of first-hand knowledge of JPL thanks to his summer 2019 internship – an opportunity that presented itself at a JPL informational session that spring at his alma mater, North Carolina A&T State University.
“That allowed me the chance to speak one-on-one with Jenny Tieu and Roslyn Soto [JPL Education project managers],” Ethridge said. “They were incredibly generous with their time and provided resume critiques, feedback, and general advice about how to get an opportunity at JPL.”
Since 2017, Tieu has been leading JPL’s Historically Black Colleges and Universities/Underrepresented Minorities, or HBCU/URM, initiative – an effort to increase and foster a more diverse workforce in technical roles at the Laboratory. It’s one of many programs facilitating the more than 550 internship opportunities offered through the Education Office this year.
Now in its fifth year, the program has seen rapid growth; from seven interns in its first year, to 24 interns in 2020. This year, JPL is welcoming 48 students interning remotely from institutions including Howard, North Carolina A&T, Tuskegee, and Prairie View A&M universities, along with underrepresented-minority students from universities including UCLA, USC, UC Riverside, Duke, Cal Poly Pomona, and more.
The initiative includes funding and support to bring in faculty from the schools to take part in research with the students, building in a cohort model that facilitates sustainable interactions with JPL.
“We’re intentional about addressing the culture shock that some of these students may experience,” Tieu said. “With the cohort model, the faculty members can provide guidance to the students while they are navigating new relationships, connections, and a new city.”
Additionally, interns are invited to participate in roundtable conversations in groups where they can share concerns and openly discuss their experiences at JPL. Tieu has also set up virtual meet-ups where students can get to know employees from outside their groups and hear talks from members of JPL’s Black Excellence Strategic Team and past HBCU alumni.
For Ethridge, being in a position to give back to the program was something he prioritized.
“I wanted to repay some of the many kindnesses that were afforded to me,” Ethridge said. “I also feel that I am in a unique position because I just recently went through the process.”
For Howard University junior Kyndall Jones, the draw to JPL came following a fellow student’s acceptance into the program.

Kyndall Jones at the NASA Armstrong Flight Research Center. Image courtesy: Kyndall Jones | + Expand image
“I was so amazed that he had an internship with NASA, and it really sparked my interest,” Jones said. “After doing my research on the program, I submitted my resume and heard back after a few months, landed an interview, and now here I am [virtually]!”
Despite the telework nature of this summer’s internship, Jones said that even from her home in Dayton, Ohio, she has been able to foster connections with JPL employees and gain valuable experience in her role working on software for an Earth-science instrument that will help NASA understand how different types of air pollution, which can cause serious health problems, affect human health.
And thanks to her mentor, Operations Systems Engineer Janelle Wellons, Jones was able to get the type of hands-on NASA experience that’s been hard to come by since the pandemic.
“My mentor Janelle suggested that I come visit Los Angeles for a few days this summer, and I was finally able to visit and explore the city for the first time,” Jones said. “I am also super grateful for her setting up a tour at the NASA Armstrong Flight Research Center where we were able to view, tour, and learn lots of interesting facts about NASA’s historical aircraft.”
Wellons – who splits her time operating instruments aboard several Earth-observing missions – had been involved in previous years’ roundtable discussions with HBCU interns, but this year, she had the opportunity to hire her own interns through the program. Being from the East Coast herself, Wellons remembers having little awareness of JPL as a potential career landing spot while studying at Massachusetts Institute of Technology.
“Getting visibility and actually partnering with these schools to make these internships happen is so important,” Wellons said. “Actively interacting with HBCUs is only going to do good for people we would otherwise potentially never get an application from, and it benefits JPL by broadening the talent pool and diversity of our workforce.”
As for the future, Jones sees the initiative as one step of many for her and fellow interns toward careers in engineering and science.
“I know a lot of Howard students that are interning or have interned with JPL, and the love from our College of Engineering and Architecture is especially high,” Jones said. “The info sessions, resume workshops, and networking workshops that JPL has been able to put on have been great, and the more they can do, the better for students.”
Tieu agrees, adding, "We are happy to see the growth of the initiative but look forward to making further progress. There's so much more we would like to accomplish in the years ahead."
To learn more about the HBCU/URM initiative and apply, see the Maximizing Student Potential in STEM program page. The HBCU/URM initiative resides within this program.
This Q&A is part of an ongoing series highlighting the stories and experiences of students and faculty who came to JPL as part of the laboratory's collaboration with historically black colleges and universities, or HBCUs. › Read more from the series
The laboratory’s STEM internship and fellowship programs are managed by the JPL Education Office. Extending the NASA Office of STEM Engagement’s reach, JPL Education seeks to create the next generation of scientists, engineers, technologists and space explorers by supporting educators and bringing the excitement of NASA missions and science to learners of all ages.
Career opportunities in STEM and beyond can be found online at jpl.jobs. Learn more about careers and life at JPL on LinkedIn and by following @nasajplcareers on Instagram.
TAGS: HBCU, Internships, College Students, Faculty, Research, Careers, Earth Science, Black History Month, Engineering, Intern, Higher Education

Teachable Moments | November 18, 2020
Earth Satellite Joins NASA Fleet to Monitor Sea Level, Improve Weather Forecasts
Learn about the mission and find out how to make classroom connections to NASA Earth science – plus explore related teaching and learning resources.
In the News
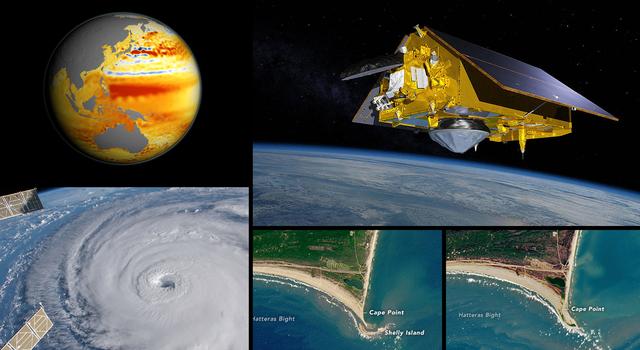
A new spacecraft that will collect vital sea-surface measurements for better understanding climate change and improving weather predictions is joining the fleet of Earth science satellites monitoring our changing planet from space. A U.S.-European partnership, the Sentinel-6 Michael Freilich satellite continues a long tradition of collecting scientific data from Earth orbit. It’s named in honor of NASA’s former Earth Science Division director and a leading advocate for ocean measurements from space.
Read on to find out how the mission will measure sea-surface height for the next 10 years and provide atmospheric data to help better predict weather. Plus, find out how to watch the launch online and explore related teaching resources to bring NASA Earth science into the classroom and incorporate sea level data into your instruction.
How It Works
The Sentinel-6 Michael Freilich satellite is designed to measure sea-surface height and improve weather predictions. Once in orbit, it will be able to measure sea-surface height – with accuracy down to the centimeter – over 90% of the world’s oceans every 10 days. It will do this using a suite of onboard science tools, or instruments.
To measure sea-surface height, a radar altimeter will send a pulse of microwave energy to the ocean’s surface and record how long it takes for the energy to return. The time it takes for the signal to return varies depending on the height of the ocean – a higher ocean surface results in a shorter return time, while a lower ocean surface results in a longer return time. A microwave radiometer will measure delays that take place as the signal travels through the atmosphere to correct for this effect and provide an even more precise measurement of sea-surface height.

This animation shows the radar pulse from the Sentinel-6 Michael Freilich satellite's altimeter bouncing off the sea surface in order to measure the height of the ocean. Image credit: NASA/JPL-Caltech | + Expand image
To measure atmospheric data, Sentinel-6 Michael Freilich is equipped with the Global Navigation Satellite System - Radio Occultation, or GNSS-RO, instrument, which will measure signals from GPS satellites – the same ones you use to navigate on Earth. As these satellites move below or rise above the horizon from Sentinel-6 Michael Freilich's perspective, their signals slow down, change frequency and bend as a result of the phenomenon known as refraction. Scientists can use these changes in the GPS signal to measure small shifts in temperature, moisture content, and density in the atmosphere. These measurements can help meteorologists improve weather forecasts.
Why It's Important
Scientists from around the world have been collecting sea level measurements for more than a century. The data – gathered from tide gauges, sediment cores, and space satellites – paint a clear picture: sea level is rising. Looking at the average height of the sea across the planet, we see that in the last 25 years global sea level has been rising an average of 0.13 inches (3.3 mm) per year. This average is increasing each year (in the 2000s, it was 0.12 inches, or 3.0 mm, per year) as is the rate at which it’s increasing. That means that sea level is rising, and it’s rising faster and faster. Since 1880, global sea level has risen more than eight inches (20 cm). By 2100, it is projected to rise another one to four feet (30 to 122 cm).
This satellite data show the change in Earth's global sea level since 1993. Roll over the chart to see the various data points. For more Earth vital signs, visit NASA's Global Climate Change website
Measuring sea level from space provides scientists with global measurements of Earth’s oceans in a matter of days, including areas far from shore where measurements aren’t practical or possible. Starting in 1992 with the launch of the TOPEX/Poseidon mission, the record of sea level measurements from space has continued uninterrupted, providing an increasingly detailed picture of Earth’s rising seas. The Sentinel-6 Michael Freilich satellite – and its twin, which will launch in 2025 – will extend those measurements to 2030, allowing scientists to continue collecting vital information about Earth’s changing oceans and climate.
Unlike previous satellites that measured sea level, Sentinel-6 Michael Freilich has the capability to measure sea level variations more accurately near coastlines, giving scientists insight into changes that can have direct impacts on communities and livelihoods, such as commercial fishing and ship navigation.
This playlist for students and teachers features explainers about the causes and effects of sea level rise and how NASA is studying our changing planet – plus related STEM activities and experiments for students. | Watch on YouTube
With rising seas already impacting people and communities, it's important to understand not just how much seas are rising, but also where and how quickly they are rising. Data from instruments on Sentinel-6 Michael Freilich can be combined with data from other satellites to get a clearer picture of what's contributing to sea level rise and where. For example, by looking at the satellite's radar altimeter measurements along with gravity measurements from the GRACE-FO mission, scientists can better determine how melting ice and thermal expansion are contributing to sea level rise. And by tracking the movement of warm water (which stands taller than cold water), scientists can better predict the rapid expansion of hurricanes.
Watch the Launch
Scheduled to launch at 9:17 a.m. PST (12:17 p.m. EST) on November 21, Sentinel-6 Michael Freilich will launch atop a SpaceX Falcon 9 rocket from Vandenberg Air Force Base in California.
Watch a live broadcast of the launch from the Vandenberg Air Force Base on NASA TV and the agency’s website. Visit the Sentinel-6 Michael Freilich website to explore more news about the mission. Follow launch updates on NASA's Twitter, Facebook and Instagram accounts.
Teach It
Make classroom connections to NASA Earth science with lessons about rising seas, thermal expansion and ice melt, data collection and graphing, and engineering. Plus explore independent activities and experiments students can do at home, video playlists, and more:
-
Lesson Collection for Educators
Explore these standards-aligned STEM lessons about launches, Earth satellites, and sea level rise to make classroom connections to the Sentinel-6 Michael Freilich mission.
Grades K-12
Time Varies
-
Learn With NASA – YouTube Playlist
This YouTube playlist for students and teachers features explainers about the causes and effects of sea level rise and how NASA is studying our changing planet – plus related STEM activities and experiments for students.
-
Teaching Space With NASA
Watch education webinars featuring NASA experts and education specialists talking about Earth science and more, explore related resources, and register to participate in an upcoming live Q&A.
-
Teachable Moments: The Science of Earth's Rising Seas
How do we know sea-level rise is happening and what’s causing it? Learn about the NASA satellites studying the problem and get students exploring the data through math.
-
Teachable Moments: NASA's Eyes on Extreme Weather
Learn about the causes and effects of extreme weather including hurricanes, floods, droughts and wildfires, plus how NASA studies them.
-
Activities for Students
Get students engaged in science and engineering related to the Sentinel-6 Michael Freilich mission with these videos and independent activities.
Type Varies
Subject Varies
-
Learning Space With NASA at Home
Explore Earth and space science activities students can do with NASA at home, watch live stream events and video tutorials, plus explore tips for home-based learning!
Explore More
- Press Kit: Sentinel-6 Michael Freilich
- Website: Sentinel-6 Michael Freilich
- Article: Meet the People Behind the Sentinel-6 Michael Freilich Spacecraft
- Article: 5 Things to Know About Sentinel-6 Michael Freilich
- Website: NASA Climate Change
- Website: Sea Level Science
- Website: NASA Climate Kids
- Article for Kids: How Do We Measure Sea Level?
- Interactive: Explore Earth Now
- Facts & Figures: Climate Change - Evidence
- Gallery: Images of Change
- Podcast: On a Mission
- Multimedia: NASA climate images, videos, and graphics
- Social Media: List of NASA social media channels
- Events: NASA Live
Recursos en Español
TAGS: Teachable Moments, Educators, Teachers, Parents, K-12 Education, Launch, Mission, Earth, Satellite, Earth Science, Climate Change, Sentinel-6 Michael Freilich, Sea Level, Sea Level Rise, Climate TM
Teachable Moments | September 14, 2020
The Science of Wildfires


Update: Sept. 14, 2020 – This feature, originally published on Aug. 23, 2016, has been updated to include information on the 2020 fires and current fire research.
In the News
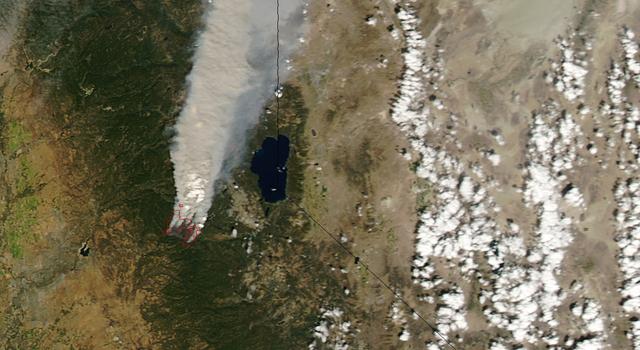
Once again, it’s fire season in the western United States with many citizens finding themselves shrouded in wildfire smoke. Late summer in the West brings heat, low humidity, and wind – optimal conditions for fire. These critical conditions have resulted in the August Complex Fire, the largest fire in California's recorded history. Burning concurrently in California are numerous other wildfires, including the SCU Lightning Complex fire, the third-largest in California history.
Fueled by high temperatures, low humidity, high winds, and years of vegetation-drying drought, more than 7,700 fires have engulfed over 3 million acres across California already this year. And the traditional fire season – the time of year when fires are more likely to start, spread, and consume resources – has only just begun.
Because of their prevalence and effects on a wide population, wildfires will remain a seasonal teachable moment for decades to come. Keep reading to find out how NASA studies wildfires and their effects on climate and communities. Plus, explore lessons to help students learn more about fires and their impacts.
How It Works
With wildfires starting earlier in the year and continuing to ignite throughout all seasons, fire season is now a year-round affair not just in California, but also around the world. In fact, the U.S. Forest Service found that fire seasons have grown longer in 25 percent of Earth's vegetation-covered areas.

This animation shows how FireSat would use a network of satellites around the Earth to detect fires faster than ever before. | + Expand image
For NASA's Jet Propulsion Laboratory, which is located in Southern California, the fires cropping up near and far are a constant reminder that its efforts to study wildfires around the world from space, the air, and on the ground are as important as ever.
JPL uses a suite of Earth satellites and airborne instruments to help better understand fires and aide in fire management and mitigation. By looking at multiple images and types of data from these instruments, scientists compare what a region looked like before, during, and after a fire, as well as how long the area takes to recover.
While the fire is burning, scientists watch its behavior from an aerial perspective to get a big-picture view of the fire itself and the air pollution it is generating in the form of smoke filled with carbon monoxide and carbon dioxide.
Natasha Stavros, a wildfire expert at JPL, joined Zach Tane with the U.S. Forest Service during a Facebook Live event to discuss some of these technologies and how they're used to understand wildfire behavior and improve wildfire recovery.
Additionally, JPL worked with a startup in San Francisco called Quadra Pi R2E to develop FireSat, a global network of satellites designed to detect wildfires and alert firefighting crews faster.
Using these technologies, NASA scientists are gaining a broader understanding of fires and their impacts.
Why It's Important
One of the ways we often hear wildfires classified is by how much area they have burned. Though this is certainly of some importance, of greater significance to fire scientists is the severity of the fire. Wildfires are classified as burning at different levels of severity: low, medium, and high. Severity is a function of intensity, or how hot the fire was, and its spread rate, or the speed at which it travels. A high-severity fire is going to do some real damage. (Severity is measured by the damage left after the fire, but can be estimated during a fire event by calculating spread rate and measuring flame height which indicates intensity.)
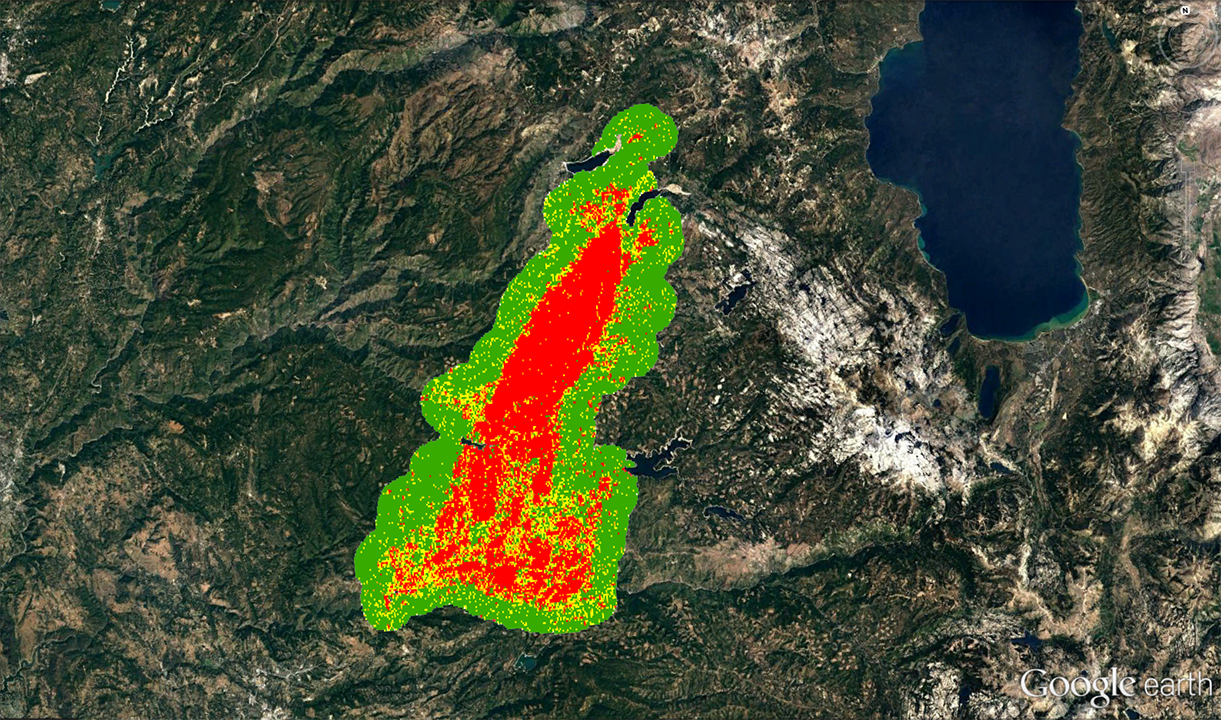
The impacts of wildfires range from the immediate and tangible to the delayed and less obvious. The potential for loss of life, property, and natural areas is one of the first threats that wildfires pose. From a financial standpoint, fires can lead to a downturn in local economies due to loss of tourism and business, high costs related to infrastructure restoration, and impacts to federal and state budgets.
The release of greenhouse gases like carbon dioxide and carbon monoxide is also an important consideration when thinking about the impacts of wildfires. Using NASA satellite data, researchers at the University of California, Berkeley, determined that between 2001 and 2010, California wildfires emitted about 46 million tons of carbon, around five to seven percent of all carbon emitted by the state during that time period.

In California and the western United States, longer fire seasons are linked to changes in spring rains, vapor pressure, and snowmelt – all of which have been connected to climate change. Wildfires serve as a climate feedback loop, meaning certain effects of wildfires – the release of CO2 and CO – contribute to climate change, thereby enhancing the factors that contribute to longer and stronger fire seasons.
While this may seem like a grim outlook, it’s worth noting that California forests still act as carbon sinks – natural environments that are capable of absorbing carbon dioxide from the atmosphere. In certain parts of the state, each hectare of redwood forest is able to store the annual greenhouse gas output of 500 Americans.
Studying and managing wildfires is important for maintaining resources, protecting people, properties, and ecosystems, and reducing air pollution, which is why JPL, NASA, and other agencies are continuing their study of these threats and developing technologies to better understand them.
Teach It
Have your students try their hands at solving some of the same fire-science problems that NASA scientists do with these two lessons that get students in grades 3 through 12 using NASA data, algebra, and geometry to approximate burn areas, fire-spread rate and fire intensity:
-
Fired Up Over Math: Studying Wildfires from Space
Students learn how scientists assess wildfires using remote sensing and solve related math problems, appropriate for various grade levels.
Grades 3-12
Time 30 mins - 1 hr
-
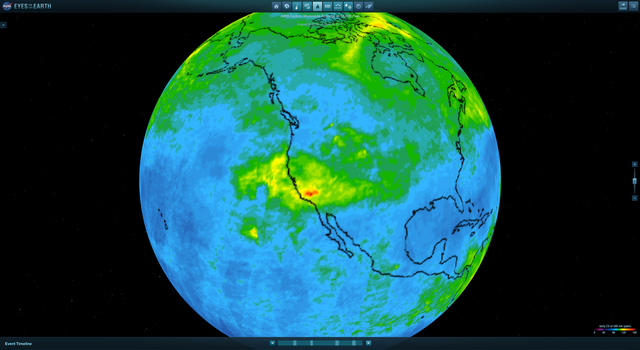
Pixels on Fire
Students use mobile devices and computers to learn about remote sensing and satellite data to determine when and where wildfires have started.
Grades 4-8
Time 30 mins - 1 hr
Explore More
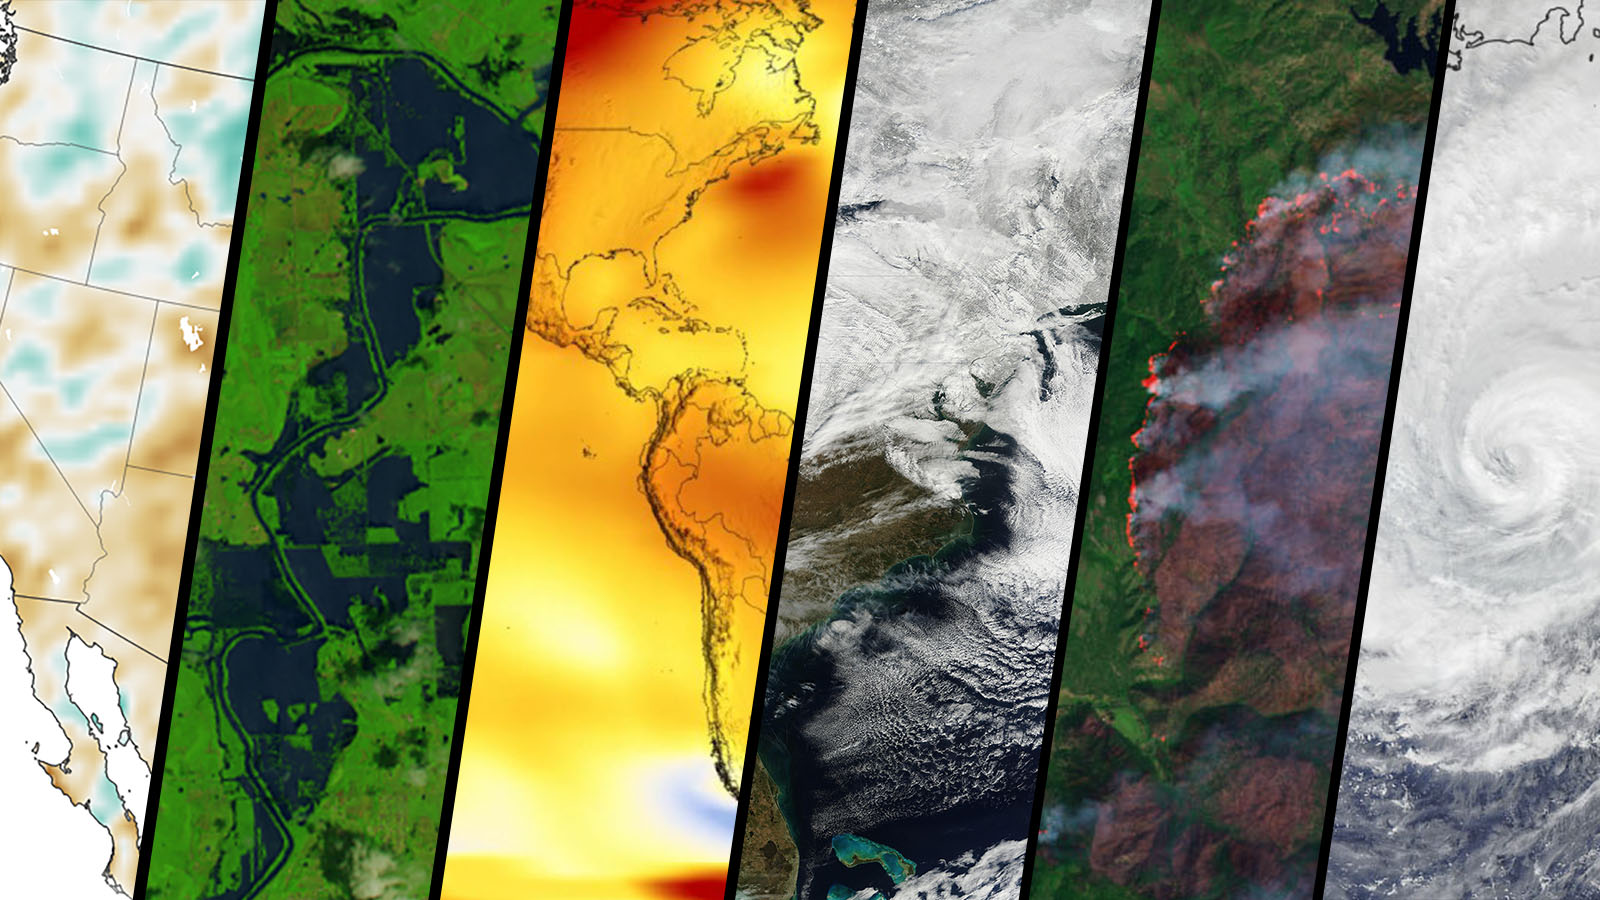
- Wildfire Images from NASA Earth Observatory
- NASA/JPL FireSat Press Release
- SciJinks: Can Meteorologists Help Fight Wildfires?
- Soberanes Fire: Image Captured by NASA's Terra Spacecraft
- Let's Clear the Air: The Danger of Forest Fire Smoke to Firefighters
- NASA Climate Change News: "Local Winds Play a Key Role in Some Megafires
- NASA Climate Change News: "Studying Weather to Help See the Likelihood of Fires"
Lyle Tavernier contributed to this feature.
TAGS: teachable moments, wildfires, science, Earth Science, Earth, Climate Change, Climate TM