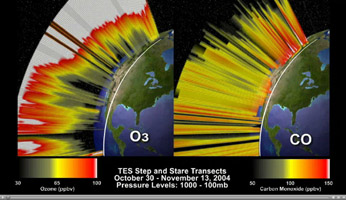
O3 and CO Transects over North America

Click on the image for the video
This animation depicts the 3-dimensional distribution of O3 and CO in the atmosphere over North America, based on Tropospheric Emission Spectrometer (TES) data acquired between October 30 and November 13, 2004. TES is a sounding, or profiling, instrument, and TES data are used to measure the variations in atmospheric chemistry with altitude. The North America survey consisted of nine TES overpasses, with 150 profiles collected during each overpass. To visualize these data we interpolated between the profiles to create cross-sections, or transects, of the atmosphere for each overpass. To simulate continuous transects of O3 and CO over the time period we interpolated between the individual transects. The end result is a pair of windows into the 3-dimensional chemical structure of the atmosphere.
For more information regarding this animation, please contact John Worden or Vincent Realmuto, Jet Propulsion Laboratory.
