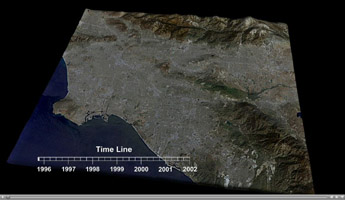
Southern California INSAR Time Series

Click on the image for the video
This animation depicts variations in surface elevation resulting from the discharge and recharge of groundwater basins in Southern California. These seasonal fluctuations, which range between -5 and +5 centimeters (-2 to +2 inches), result from the pumping of groundwater during the dry season (Summer/Fall) and recharge of the basins during the wet season (Winter/Spring). Reductions in elevation, resulting from extraction of groundwater, are shown in orange, while increases in elevation, resulting from the recharge of the basins, are shown in blue.
In addition to the annual fluctuations, a net decrease is seen in elevation over the 6+ years of this study due to compaction of the basin sediments over time. This compaction results in a loss of storage capacity in the groundwater basins.
The spatial and temporal patterns of ground deformation were measured with radar interferometry, generating more than 42 interferograms from synthetic aperture radar (SAR) acquired by ESA's ERS-1 and ERS-2 satellites. An interferogram is a map of the relative changes in the distance between the satellite and surface of the earth, expressed as differences in phase. The interferometric technique measures ground deformation with a precision of 2.8 centimeters (~ 1 inch).
SAR data and analysis courtesy of Paul Lundgren of the Jet Propulsion Laboratory. For more information regarding this animation, please contact Paul Lundgren or Vincent Realmuto, Jet Propulsion Laboratory.
Reference: Lanari, R., P. Lundgren, M. Manzo, and F. Casu (2004), Satellite radar interferometry time series analysis of surface deformation for Los Angeles, California, Geophys. Res. Lett., 31, L23613, doi:10.1029/2004GL021294.
