JPL
Careers
Education
Science & Technology
JPL Logo
JPL Logo
Earthquakes
.

NASA Maps Ground Changes From Puerto Rico Quake

Written by Esprit Smith Jan. 10, 2020
This map shows ground changes, or displacement, on the eastern two-thirds of Puerto Rico following a 6.4-magnitude earthquake.
Credit: NASA/JPL-Caltech, ESA, USGS
Full Image Details

Scientists use satellite data to help response agencies identify damaged areas.

Days after a 6.4-magnitude earthquake rocked Puerto Rico, followed by hundreds of aftershocks, the full extent of damage is only beginning to be realized.

NASA scientists are using satellite data to help federal and local agencies identify areas with potential damage. Earthquakes cause permanent changes to the ground surface. By comparing interferometric synthetic aperture radar (InSAR) data acquired on Jan. 9, 2020, with data acquired on Dec. 28, 2019, from the Copernicus Sentinel-1A satellite, the scientists were able to map where, how much and in what direction those changes occurred.

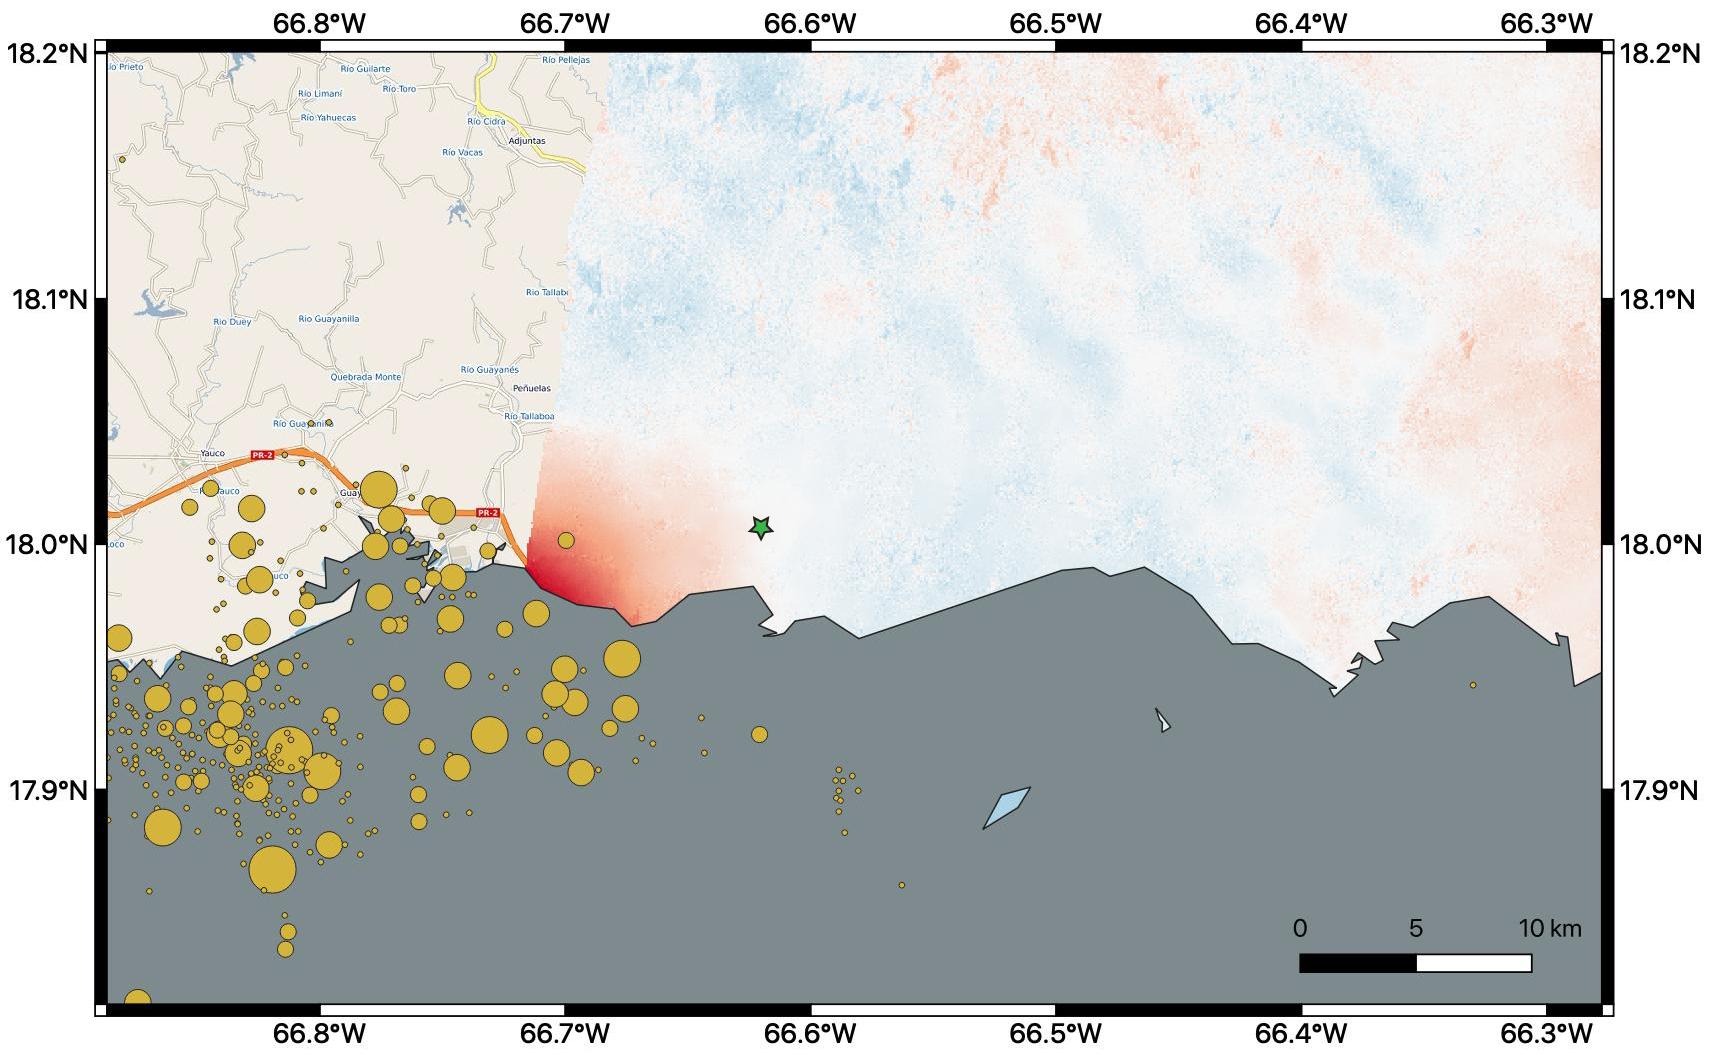
Managed by the European Space Agency (ESA), the Copernicus Sentinel-1A satellite was able to see the eastern two-thirds of the island during the Jan. 9 flyover. On the map, red indicates areas where the ground was changed, or displaced, with darker shades corresponding to more significant displacement. The scientists found that the greatest displacement from the flyover area occurred west of the city of Ponce (identified by the green star), not far from the quake's offshore epicenter. They recorded up to 5.5 inches (14 centimeters) of ground change there. The ground appeared to shift downward and slightly to the west.

The quake epicenter and the cluster of quakes and aftershocks in the region identified by the United States Geological Survey (shown as orange circles) fall just west of the satellite's Jan. 9 track. Because of this, scientists also plan to analyze data from Sentinel-1A's forthcoming Jan. 14 flyover, which will include western Puerto Rico.

The NASA Earth Applied Sciences Disasters Program has activated Tier 1 response in support of this disaster and is in contact with the Federal Emergency Management Agency, the United States Geological Survey and Health and Human Services (HHS) to provide NASA Earth-observing data in support of response and recovery efforts. Products in the process of being produced include Suomi-NPP-based "Black Marble" power outage maps, damage maps, and landslide maps. A webpage has also been created on the NASA Disasters Mapping Portal to supply relevant GIS data products.

The map contains modified Copernicus Sentinel data processed by ESA and analyzed by scientists at NASA's Jet Propulsion Laboratory, and earthquake location data from the USGS.

News Media Contact

Arielle Samuelson

Jet Propulsion Laboratory, Pasadena, Calif.

818-354-0307

arielle.a.samuelson@jpl.nasa.gov

2020-006

Related News

Climate Change .

Google’s ‘A Passage of Water’ Brings NASA’s Water Data to Life

Earth .

NASA Mission Excels at Spotting Greenhouse Gas Emission Sources

Earth .

Trailblazing New Earth Satellite Put to Test in Preparation for Launch

Earth .

NASA Analysis Finds Strong El Niño Could Bring Extra Floods This Winter

Earth .

NASA Flights Link Methane Plumes to Tundra Fires in Western Alaska

Earth .

See SWOT Mission’s Unprecedented View of Global Sea Levels

Earth .

NASA-ISRO Radar Mission to Provide Dynamic View of Forests, Wetlands

Earth .

International Ocean Satellite Monitors How El Niño Is Shaping Up

Earth .

NASA-Led Study Pinpoints Areas of New York City Sinking, Rising

Earth .

Water-Watching Satellite Monitors Warming Ocean off California Coast

Explore More

Image .

NISAR Passes Thermal Vacuum Test in Indian Spacecraft Facility

Image .

NISAR Completes Trial in ISRO's Compact Antenna Test Facility

Image .

SWOT Monitors El Niño off Peru

Video .

Methane Hot Spots

Image .

SWOT's Detailed View of Global Sea Level

Image .

Composite of Brazil's 'Arc of Deforestation' Shows Imagery NISAR Will Produce

Image .

Radar Image of Amazonian Flooding Similar to Future NISAR Imagery

Image .

Hot Spots of Subsidence, Uplift in New York City

Image .

Map of New York City Subsidence and Uplift

Image .

SWOT Monitors Warming Waters Off California Coast

About JPL
Who We Are
Executive Council
Directors
Careers
Internships
The JPL Story
JPL Achievements
Documentary Series
Annual Reports
JPL Plan: 2023-2026
Missions
Current
Past
Future
All
News
All
Earth
Solar System
Stars and Galaxies
Subscribe to JPL News
Galleries
Images
Videos
Audio
Podcasts
Apps
Visions of the Future
Slice of History
Robotics at JPL
Events
Lecture Series
Team Competitions
Speakers Bureau
Calendar
Visit
Public Tours
Virtual Tour
Directions and Maps
Topics
JPL Life
Solar System
Mars
Earth
Climate Change
Exoplanets
Stars and Galaxies
Robotics
More
Asteroid Watch
NASA's Eyes Visualizations
Universe - Internal Newsletter
Social Media
Get the Latest from JPL
Follow Us

JPL is a federally funded research and development center managed for NASA by Caltech.

More from JPL
Careers Education Science & Technology Acquisitions JPL Store
Careers
Education
Science & Technology
Acquisitions
JPL Store
Related NASA Sites
Basics of Spaceflight
Climate Kids
Earth / Global Climate Change
Exoplanet Exploration
Mars Exploration
Solar System Exploration
Space Place
NASA's Eyes Visualization Project
Voyager Interstellar Mission
NASA
Caltech
Privacy
Image Policy
FAQ
Feedback
Site Managers: Veronica McGregor, Randal Jackson
Site Editors: Tony Greicius, Naomi Hartono
CL#: 21-0018