New Views of Earth's Gravity Field from GRACE

 |  |
| Map 1 | Map 2 |
Gravity and the Earth's Shape
Gravity is the force that is responsible for the weight of an object and is determined by how the material that makes up the Earth is distributed throughout the Earth. Because gravity changes over the surface of the Earth, the weight of an object changes along with it. One can define standard gravity as the value of gravity for an perfectly smooth 'idealized' Earth, and the gravity 'anomaly' is a measure of how actual gravity deviates from this standard. Gravity reflects the Earth's surface topography to a high degree and is associated with features that most people are familiar with such as large mountains and deep ocean trenches.
Progress in Measuring the Earth's Gravity Field Through GRACE
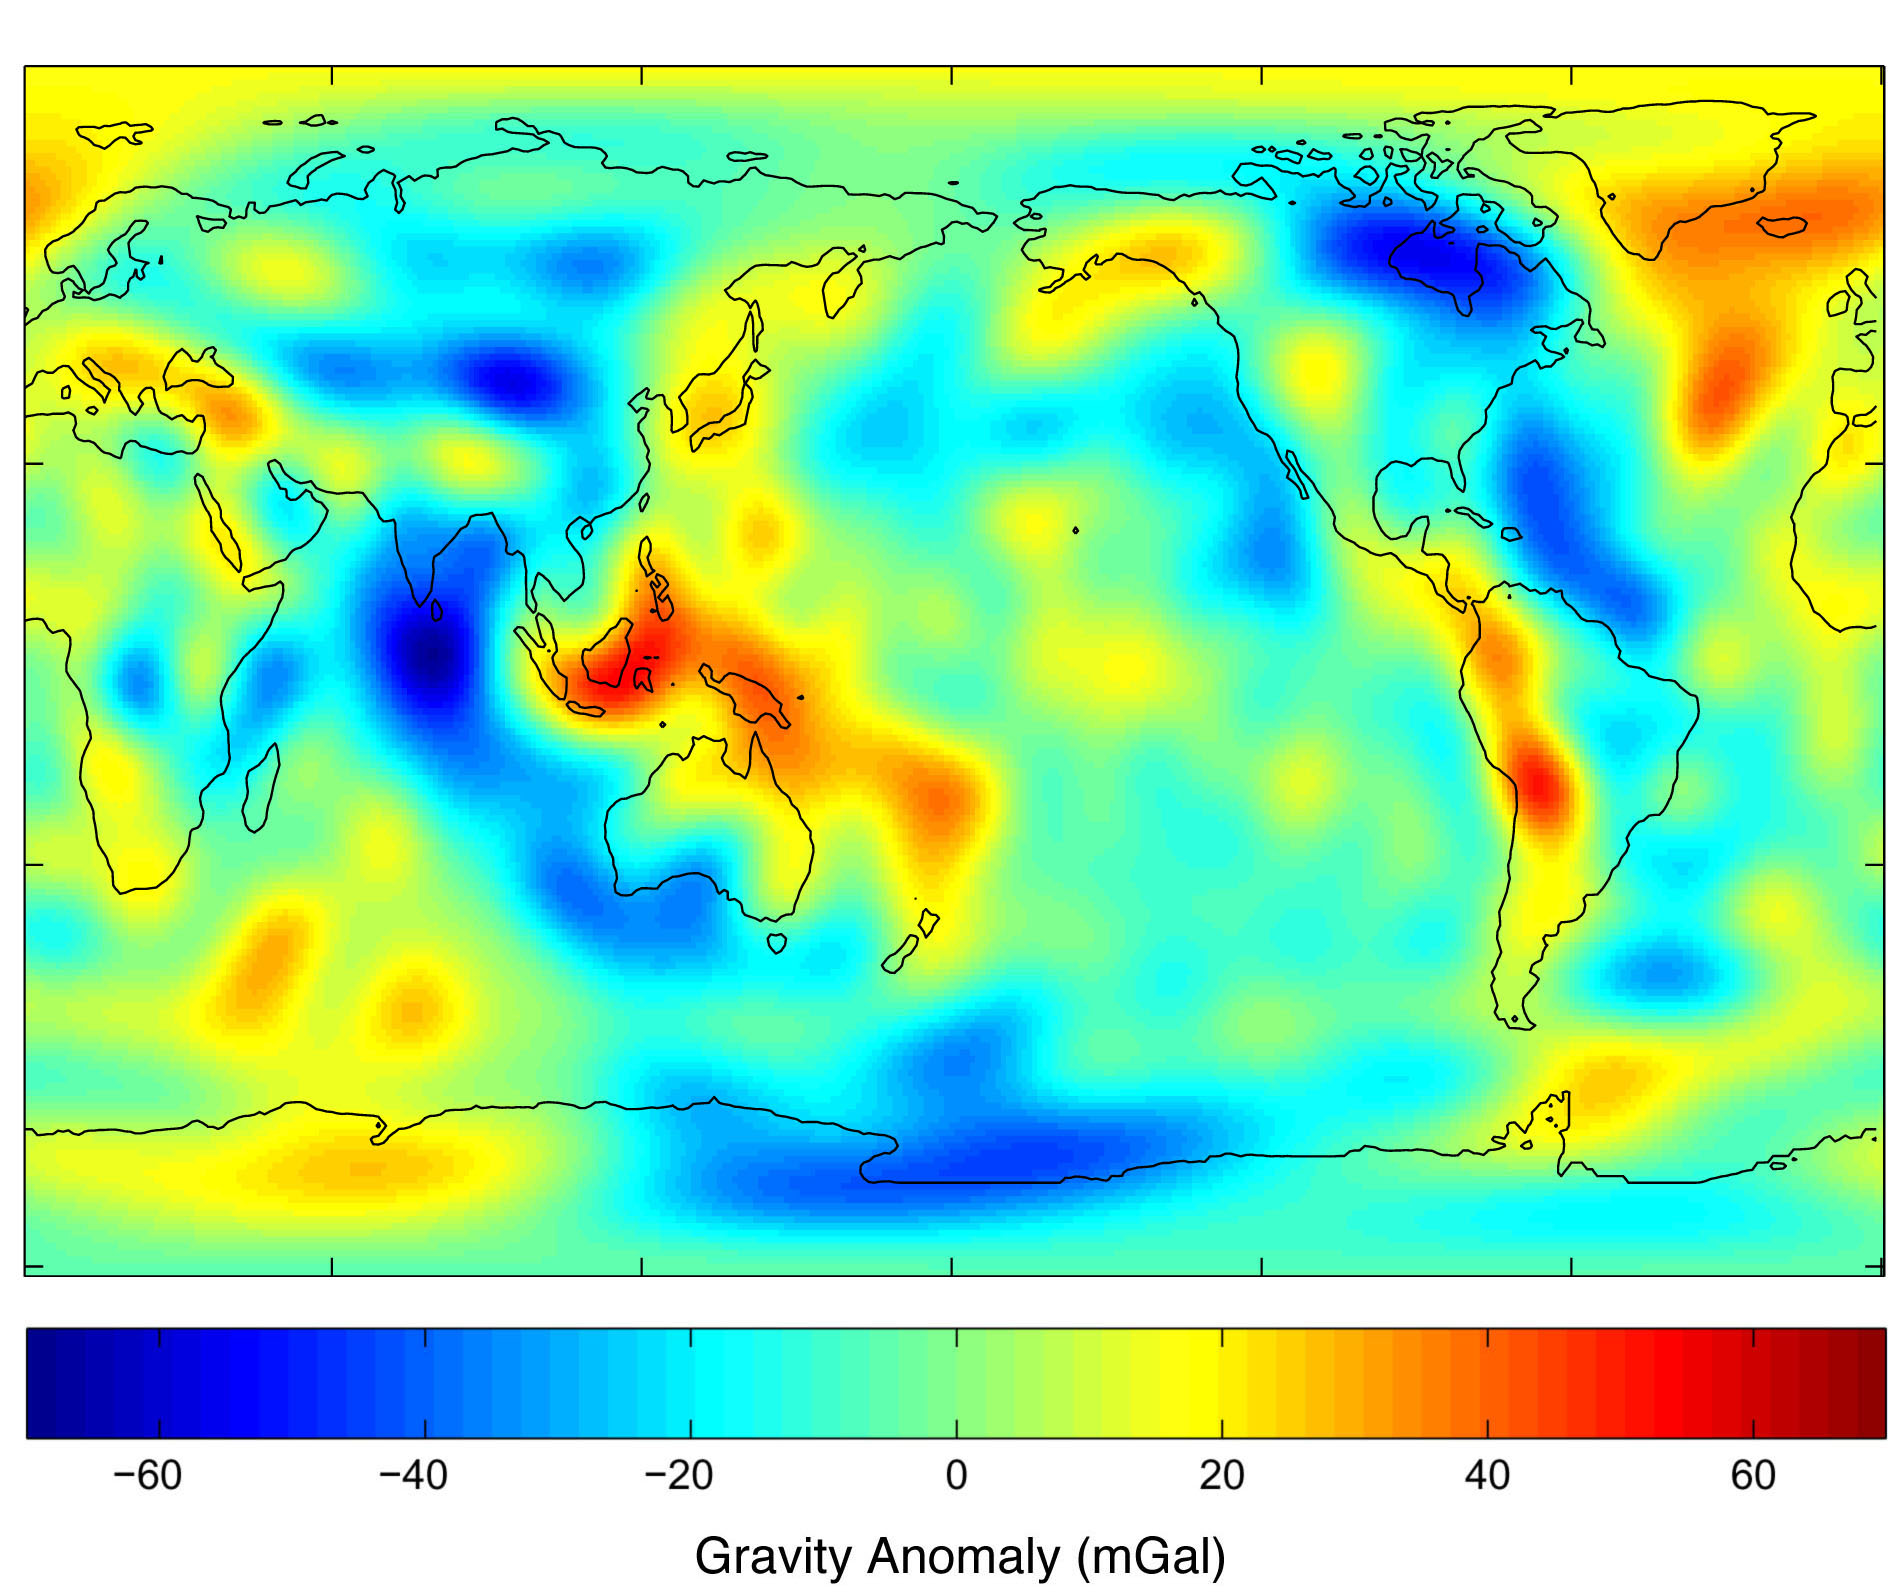
Prior to GRACE, the Earth's gravity field was determined using measurements of varying quality from different satellites and of incomplete coverage. Consequently the accuracy and resolution of the gravity field were limited. As is shown in Figure 1, the long wavelength components of the gravity field determined from satellite tracking were limited to a resolution of approximately 700 km. At shorter wavelengths, the errors were too large to be useful. Only broad geophysical features of the Earth's structure could be detected (see map 1).
In contrast, GRACE, by itself, has provided accurate gravity information with a resolution of 200 km. Now, much more detail is clearly evident in the Earth's geophysical features (see map 2). High resolution features detected by GRACE that are representative of geophysical phenomena include the Tonga/Kermadec region (a zone where one tectonic plate slides under another), the Himalayan/Tibetan Plateau region (an area of uplift due to colliding plates), and the mid-Atlantic ridge (an active spreading center in the middle of the Atlantic ocean where new crust is being created). Future GRACE gravity models are expected to increase the resolution further. The second figure confirms that the Grace data is global, homogeneous and highly accurate. These are all properties that have been sought for gravity model development.

Ocean Circulation Measurements from Grace
The arrows in the three data sets in Figure 3 depict ocean currents off the East Coast of the United States, 1,000 meters (approximately 3,280 feet) beneath the surface. The top panel is obtained from the GRACE geoid, satellite altimetry and ship measurements of temperature and salt. The bottom panel is computed in the same manner as the top one, except that the best geoid prior to GRACE is used instead of the GRACE geoid. The middle panel shows direct measurement of those currents by floats deployed from ships. Notice that the current arrows in the Gulf Stream extension, East and slightly South of Washington DC, point eastward, toward Europe, in the two upper panels, but in the opposite direction in the lower panel. Colors indicate the strength of the ocean current, with red being strongest and blue-green weakest. Areas in white have no available data.
The Gulf Stream region of the North Atlantic is among the best studied in the world's oceans, with a significant quantity of high-quality data available on it as a result of shipborne instrument measurements. In less well studied regions, the new information provided by GRACE, together with satellite altimetry, will increase our knowledge of ocean circulation.