Lesson .
.Measuring the Supermoon
Overview
Students compare month-to-month analog or digital measurements collected during multiple full moons.
Materials
- Ruler, meterstick or yardstick
- Paper
- Clipboard or letter-size sheet of cardboard
- Pencil
- Mobile devices with a camera app
- Measuring the Moon (Digital) Student Worksheet – Download PDF
- Measuring the Moon (Analog) Student Worksheet – Download PDF
- Calculating the Brightness of the Moon Student Worksheet – Download PDF
Management
- Data is collected by students over the course of multiple months and compared. It may be necessary to collect and hold student data (either physically or digitally) so that it is not lost during the course of this lesson.
- Because the Moon measurements need to be taken at night and away from school, students will encounter various conditions. Having students work in groups to collect and analyze data will enable students who were unable to collect all the data to still actively participate.
- Model how to conduct the Moon measurement steps to provide an example of what students should do when they take measurements at home.
Background
As the Moon orbits Earth, it goes through phases, which are determined by its position relative to Earth and the Sun. When the Moon lines up on the opposite side of Earth from the Sun, we see a full moon. The new moon phase occurs when the Moon and the Sun are lined up on the same side of Earth.
The Moon doesn’t orbit in a perfect circle. Instead, it travels in an ellipse that brings the Moon closer to and farther from Earth in its orbit. The farthest point in this ellipse is called the apogee and is about 405,500 kilometers from Earth on average. Its closest point is the perigee, which is an average distance of about 363,300 kilometers from Earth. During every 27-day orbit around Earth, the Moon reaches both its apogee and perigee.
Full moons can occur at any point along the Moon’s elliptical path, but when a full moon occurs at or near the perigee, it looks slightly larger and brighter than a typical full moon. That’s what the term “supermoon" refers to.
What makes a supermoon super? Watch this short animation to find out. Credit: NASA/JPL-Caltech
Because supermoon is not an official astronomical term, there is no definition about just how close to perigee the full moon has to be in order to be called “super." Generally, supermoon is used to refer to a full moon 90 percent or closer to perigee. (When the term supermoon was originally coined, it was also used to describe a new moon in the same position, but since the new moon isn’t easily visible from Earth, it’s rarely used in that context anymore.)
A more accurate and scientific term is “perigee syzygy.” Syzygy is the alignment of three celestial bodies, in this case the Sun, Moon and Earth. But that doesn’t quite roll off the tongue as easily as supermoon.
Procedures
Make note of where the full Moon is in the sky. Students can use stationary objects (buildings, trees, power poles, etc.) to find its relative location or measure the Moon’s location using altitude (vertical position) and azimuth (horizontal position).
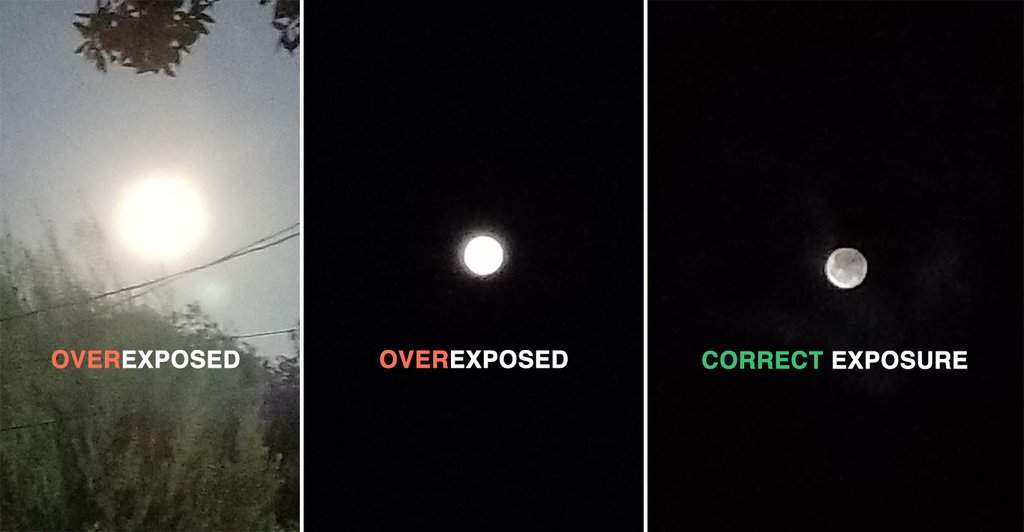
Launch the mobile device’s camera app. Using the camera’s exposure control, reduce the exposure so the Moon doesn’t appear overexposed. It should appear dim, perhaps with grey areas (the Moon’s mare), not bright white. An overexposed Moon image will make finding the edge and measuring its size impossible.
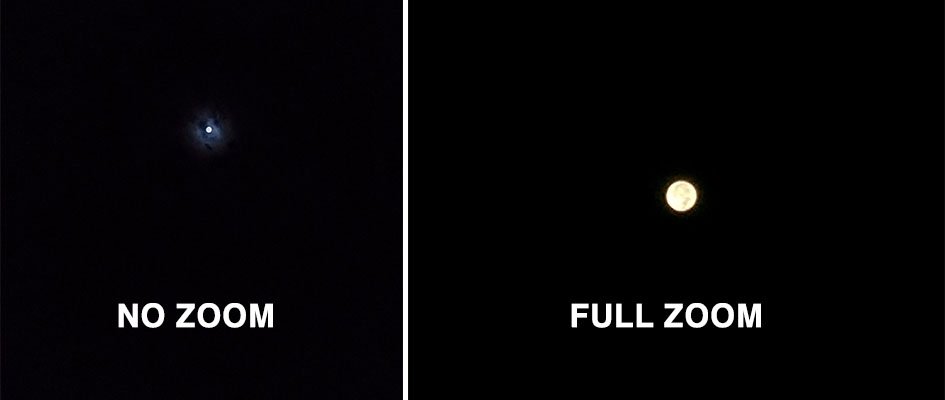
Students can use the camera to zoom in on the Moon, but they must be sure they record the zoom factor (e.g., 2.0x, 3.4x). If the camera does not display zoom factor, they should zoom in all the way. Do not zoom part way if the camera does not display zoom factor as students may not be able to find the exact zoom position for future measurements.
Take a picture of the Moon. Consider propping the device on something to hold it steady and capture a sharper image. Students might want to take several pictures and work with the best one.
Measure the number of pixels across the disk of the Moon. There are several options:
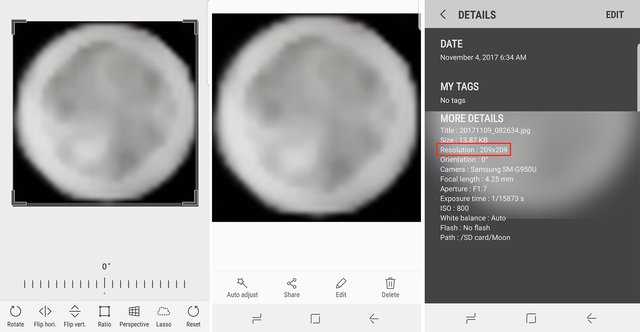
Figure 1
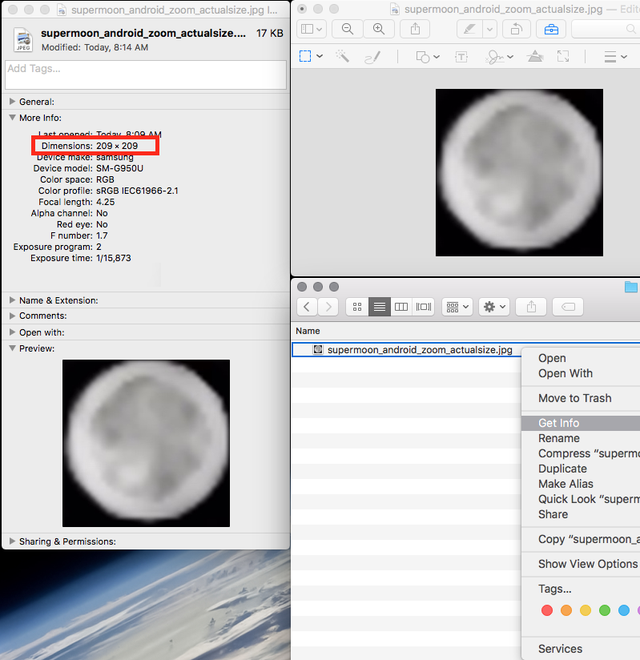
Figure 2.
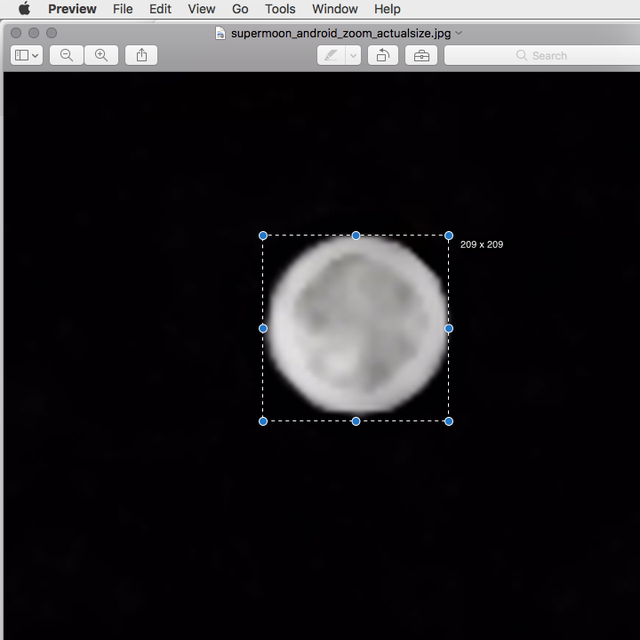
Figure 3.
- Crop the image to the size of the Moon and find the size of the image within the mobile device: Locking the aspect ratio at 1:1 will constrain students to a square, helping to accurately crop the Moon’s dimensions. Within Android mobile devices, looking at photo details or info will give students pixel dimensions of an image. If the image is cropped to the size of the Moon, the image size is also the pixel measurement across the Moon. Students using iOS devices may need to download a third-party app such as Photo Investigator or Picture Information Extractor to view the pixel dimensions of the image. (See Figure 1.)
- Crop the image to the size of the Moon within the mobile device, then transfer the image to a computer: Again, locking the aspect ratio at 1:1 will constrain students to a square, helping to accurately crop the Moon’s dimensions. Right-click on the file and select Properties (Windows) or Get Info (Mac) to view pixel dimensions. (See Figure 2.)
- Transfer the image to a computer and use an on-screen pixel ruler such as PixelRuler or PicPick for Windows, or Preview in MacOS to click and drag a pixel readout over the image. In both cases, students should make note of how much the image is zoomed (e.g., actual size, 150%, 200%, etc.) and use that same setting each time they measure the pixel dimensions of the Moon. (See Figure 3.)
Students repeat this procedure during multiple successive full moons, while the Moon is in the same approximate spot in the sky (recorded in Step 1).
Compare measurements from month to month using the questions on the student data sheet:
- What is the largest pixel dimension measured?
- What is the smallest pixel dimension measured?
- What is the ratio between the largest pixel measurement and the smallest pixel measurement?
- What percentage change is there between the smallest pixel measurement and the largest pixel measurement?
Make note of where the full Moon is in the sky. Students can use stationary objects (buildings, trees, power poles, etc.) to find its relative location, or measure the Moon’s location using altitude (vertical position) and azimuth (horizontal position).
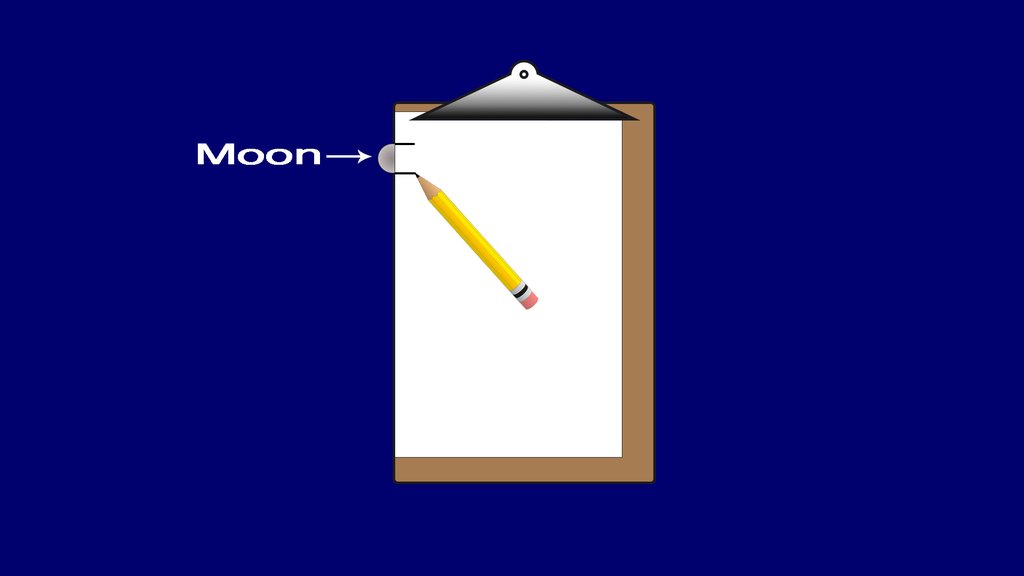
Line up the edge of the paper with the edge of the clipboard or cardboard and clip or tape the paper down securely.
With the paper secured, students should place or hold the paper a measured distance (one to two feet) from their face so that they can see the Moon and the paper. Make note of this distance. It will be important to use this same distance for each Moon measurement.
Line up the edge of the paper with the Moon.
Students repeat this procedure during multiple successive full moons, while the Moon is in the same approximate spot in the sky (recorded in Step 1), placing the paper the same distance from their face each time.
Compare measurements from month to month using questions on the student data sheet:
- What is the largest diameter measured?
- What is the smallest diameter measured?
- What is the ratio between the largest diameter measured and the smallest diameter measured?
- What percentage increase is there between the smallest diameter measured and the largest diameter measured?
Discussion
The supermoon can appear up to 14% larger in diameter than a full moon at apogee. Did the comparisons between Moon measurements show a size difference of 14%? If not, why?
The comparisons may not have been made between the supermoon (closest to Earth and largest apparent diameter) and a full moon at apogee (farthest from Earth and smallest apparent diameter).
If pencil and paper were used to measure the Moon’s apparent diameter, holding the paper closer or farther away during successive measurements could account for a difference in apparent diameters.
In a digital image, an overexposed Moon appears larger than it actually is, which would affect results.
This is a great opportunity to discuss the importance of and difficulty in obtaining accurate measurements.
Different maximum apogee and minimum perigee distances will result in different calculations from year to year (e.g., 1.299 for 2018 compared with 1.295 for 2017), but students should find that the brightness intensity of a supermoon is approximately 30% brighter than the brightness intensity of a full moon at apogee (ratio of 1.3).
Assessment
- Students should find that the intensity of the full supermoon is approximately 30% (1.3 times) higher than the intensity of a full Moon at apogee.
- Comparing measurements of the Moon’s diameter as observed during a full moon versus a supermoon should show a difference in diameter of up to 14%. This will vary depending on when students measure the Moon and how accurate their measurements are.
Extensions
- NASA's Moon Website
- Modeling the Earth-Moon System – Using an assortment of playground and toy balls, students will measure diameter, calculate distance and scale, and build a model of the Earth-Moon system.
- Moon Phases – Students learn about the phases of the Moon by acting them out. In 30 minutes, they will act out one complete Moon cycle.
- Whip Up a Moon-Like Crater – Whip up a Moon-like crater with baking ingredients as a demonstration for students.
This activity is related to a Teachable Moment from Nov. 15, 2017. See "What Is a Supermoon and Just How Super Is It?"
Lesson Last Updated: Sept. 27, 2025

