Lesson .
.Tracking Water Using NASA Satellite Data

Overview
Using real data from NASA’s GRACE satellites, students will track water mass changes in the U.S. Students will estimate water resources using heat-map data, create a line graph for a specific location, then assess trends and discuss implications.
Materials
- Color copies of GRACE heat maps for each month (one-year set per team) – Download ZIP (5.1 MB)
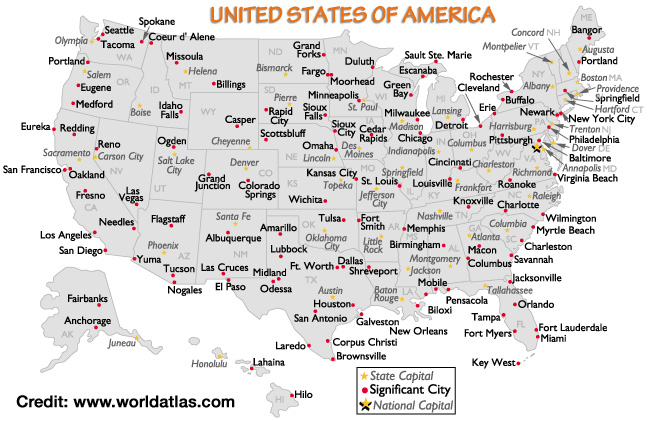
- U.S. map showing major cities (credit: www.worldatlas.com), OR access to online mapping software
- Graph paper, quadrille ruled OR student worksheet - Download PDF
- Pencils
- (Optional) colored pencils
- Ruler
- Tape
Management
- Organize students into a total of 10 groups so each group analyzes data from one year, 2003-2012. If more groups are needed to accommodate a larger class, have some groups do the same year, then compare the resulting line graphs.
- For each group, print color copies of the heat maps for all 12 months of one year, or have the students electronically access the animation.
- Prepare a copy of the U.S. map for each group, or have students access online mapping software.
- To learn more about heat maps, see the lesson Earth Science Visualization: How to Read a Heat Map.
Background
The GRACE-FO mission, a partnership between NASA and the German Research Centre for Geosciences (GFZ), will measure small variations in Earth’s mass to track how and where water is moving across the planet. This is no easy task, as water can be solid, liquid or gas; it can be in plain sight (as in a lake or glacier); it can be in the atmosphere or hidden underground; and it’s always on the move. But one thing all this water has in common, regardless of what state of matter it is in or where it is located, is mass.
In this episode of "Crazy Engineering," JPL engineer Mike Meacham explains how the GRACE-FO mission will track water resources across the globe. Watch on YouTube
Everything that has mass exerts a gravitational force. It is this gravitational force that GRACE-FO measures to track the whereabouts of water on Earth. Most of Earth’s gravitational force, more than 99 percent, does not change from one month to the next because it is exerted by Earth’s solid surface and interior. GRACE-FO is sensitive enough to measure the tiny amount that does change – mostly as a result of the movement of water within the Earth system.
GRACE-FO works by flying two spacecraft in tandem around Earth – one spacecraft trailing the other at a distance of about 137 miles (220 kilometers). By pointing their microwave ranging instruments at each other, the satellites can measure tiny changes in the distance between them – within one micron (the diameter of a blood cell) – caused by changes in Earth’s gravitational field. Scientists can then use those measurements to create a map of Earth’s global gravitational field and calculate local mass variations.
As the forward spacecraft travels over a region that has more or less mass than the surrounding areas, such as a mountain or low valley, the gravitational attraction of that mass will cause the spacecraft to speed up or slow down, slightly increasing or decreasing the relative distance between it and its trailing companion. As a result of this effect, GRACE-FO will be able to track water as it moves into or out of a region, changing the region’s mass and, therefore, its gravity. In fact, the previous GRACE spacecraft measured a weakening gravity field over several years in Central California, enabling an estimate of aquifer depletion, and in Greenland, providing accurate measurements of ice melt over more than 15 years.
Tracking changes in our water resources and the water cycle is important for everyone. The water cycle is one of the fundamental processes on Earth that sustains life and shapes our planet, moving water between Earth's oceans, atmosphere and land. Over thousands of years, we have developed our civilizations around that cycle, placing cities and agriculture near rivers and the sea, building reservoirs and canals to bring water to where it is needed and drilling wells to pump water from the ground. We depend on this cycle for the water resources that we need and, as those resources change, communities and livelihoods are affected. For example, too much water in an area causes dangerous floods that can destroy property, crops and infrastructure. Too little water causes shortages, which require us to reduce how much water we use. GRACE-FO will provide monthly data that will help us study those precious water resources.

Changes to Earth’s water over multiple years are an important indicator of how Earth is responding in a changing climate. Monitoring changes in ice sheets and glaciers, surface and underground water storage, the amount of water in large lakes and rivers, as well as changes in sea level and ocean currents, provides a global view of how Earth’s water cycle and energy balance are evolving. As our climate changes and our local water resources shift, we need accurate observations and continuous measurements like those from GRACE Follow-On to be able to respond and plan.
As a result of the 15-year GRACE mission, GRACE FO’s predecessor, we have a much more accurate picture of how our global water resources are evolving in both the short and long term. GRACE-FO will continue the legacy of GRACE, yielding up-to-date water and surface mass information and allowing us to identify trends over the coming years.
Procedures
Show students this video to introduce ground-water resources:
Define GRACE: The Gravity Research And Climate Experiment is an Earth science mission that’s a collaborative effort between the U.S. and Germany.
Define GRACE’s mission: To orbit Earth (16 times a day!) and measure small variations in Earth’s gravitational field to track how and where water mass is moving across the planet. Show this video to introduce the GRACE-FO mission:
Explain that multi-colored maps like the ones shown in the animation are called “heat maps,” but don’t track temperature as the name might imply. Instead, heat maps show the amount of something at a particular location. In this case, we are tracking variations in Earth’s gravity field which indicate water mass changes.
Show students this animation:
Ask students what the animation is showing. Answer: The highs and lows of combined land-water storage (snow, soil moisture and surface water) represented as millimeters of equivalent water over time (January 2003-February 2013).
Ask students why it might be important to track water.
Show this video to explain how weight, mass and water tracking are related, and how the GRACE satellites work:
Discuss that gravity is a force (a pull) and mass is “stuff.” The more stuff (mass) there is, the more pull (gravity) there is. The force of gravity is proportional to the mass of an object. Use the example of Earth and the Moon. Earth has more mass than the Moon and thus the gravitational pull of Earth is more than the gravitational pull of the Moon.
Discuss that we often reference the weight of an item rather than its mass, but mass is preferred because the weight of an item can vary. Explain that weight is a measure of the force exerted on the mass by gravity. As such, the weight of an object can change depending on location, but mass remains the same. For example, the pull of gravity is smaller on the Moon than on Earth (because the Moon has less mass). So if you went to the Moon, your mass (stuff) would stay the same but the lower gravity would make you weigh less. Show this video of astronaut John Young jumping on the moon that exhibits a human of the same mass as he was on Earth weighing less on the Moon.
Replay the heat map animation from step 5, pausing at the beginning of the data set, January 2003. Ask students to identify their location on the map. Use online mapping software or a copy of a U.S. map, if needed.
Continue playing the animation while students watch changes in their region.
Pause several times and ask students to use the color bar below the map to state the numerical value of millimeters of water (mm-H20) for the given month.
Ask students to identify a region (such as Southern California, Eastern Texas, Central Washington, etc.) that is experiencing great changes over time. Replay the animation as needed.
Use the U.S. map to identify a city within a region that is experiencing great changes over time.
Replay the animation and pause at various points, asking students to estimate what is happening over time near the chosen city. (e.g., Is the water amount increasing or decreasing related to the previous month?)
Ask students to explain how they know what is happening. Answer: The color bar below the map indicates the amount of equivalent water. Changing colors on the map indicate changing water amounts at that location.
Divide the class into groups and have each group mark the chosen city with a dot on each of their monthly maps. Project a U.S. map on a screen and mark the exact location so students can reference it. Be sure all groups have the same location pinpointed on their maps.
Explain to students that they will be making a giant line graph of data for 2003-2012 as a class, with each group graphing all the months of one year.
Provide each group with a sheet of graph paper, on which they will graph their points.
Have each group label the months across the horizontal (x) axis at distance intervals agreed upon by the class. All groups should use the same scale so graphs can be easily combined. Agree on whether the paper should be oriented “landscape” or “portrait” so combining them at the end of the activity will be easier.
Have each group label the vertical (y) axis at intervals appropriate for the task. Discuss that the y-axis should be labeled with a range that will accommodate the measurement of mm-H2O as indicated by the color bar at the bottom of the heat maps. All groups should use the same scale so graphs can be easily combined.
Have students title their graphs appropriately. The title should include what is being represented by the graph (amount of equivalent water), the year and the location.
Have groups plot their data and connect the dots with a straight line.
Have groups present each year’s data and trends to the class. Ask: What months does the gravity (water storage) increase or decrease?

Discuss seasonal differences and variation.
Have the students tape their graphs together on a wall or whiteboard, lining up the years in sequential order. Or, create a new, larger class graph and have each group plot their data, connecting sequential points with a line. Use colored pencils to differentiate years.
As a class, examine the overall trends. Ask: What is happening at the location over the 10-year time span? Why is this happening?
If multiple classes are involved, have each class choose a different location for their graphs. Leave all graphs displayed for discussion the following day.
Compare students’ estimation graphs to actual data using this mascon (mass concentration) visualization tool.
Click on “Annual” in the upper left corner of the screen.

Zoom in on the mascon box that contains your chosen city. Click on the mascon to reveal a dialog box containing data details.

Compare the line graph of actual data to your class graph. Are they similar? How do they differ? What accounts for the differences? Note: The actual data are collected as the spacecraft passes over that location on the globe, so they are plotted using an x-axis value of the day of the mission (the number of days that have elapsed since the mission began). These data points occur roughly once per month but the actual number of days between data points can vary.
For a closer look at the data, adjust the year slider on the bottom of the dialog box.

Have students discuss the implications of evolving global water resources. What do these changes mean for individuals and communities?
Explain that the GRACE mission ended in 2017, but the GRACE-FO mission will pick up data collection in 2018. Show this video to conclude class:


Assessment
- Assess that students can read a heat map and graph the data.
- Assess that students can interpret and evaluate the data through oral discussion of how water mass is changing in their location over one year.
- Assess that students understand the implications of water mass movement and can infer the reasons why or predict what will happen.
Suggested rubric:
| 0 | 1 | 2 |
|---|---|---|
Students are unable to articulate what a heat map communicates and did not graph data. | Students produced a graph but are unable to articulate what data the heat map provides. | Students are able to articulate the data presented in their heat maps and how the data translate to their graph. |
Extensions
- Ask questions or lead a discussion regarding how the satellites acquire these data. What is really happening?
- Identify the parts of the GRACE satellites; draw a sketch; make a model
- Observe trends in different countries or continents around the world. Get started here and here.
- Have students find the line of best fit for the class graph.
- Watch this video to observe Greenland ice loss 2002-2016:
- Watch this video to observe Antarctic ice loss 2002-2016:
Lesson concept by LoriAnn Pawlik, Prince William County Public Schools, Woodbridge, Virginia. Read more about Ms. Pawlik and how she developed the lesson on NASA/JPL Edu's Teacher Feature blog.
This activity is related to a Teachable Moment from May 2018. See "NASA Mission Gets the View on Earth's Water Resources from Space."