project
How Melting Ice Causes Sea Level Rise
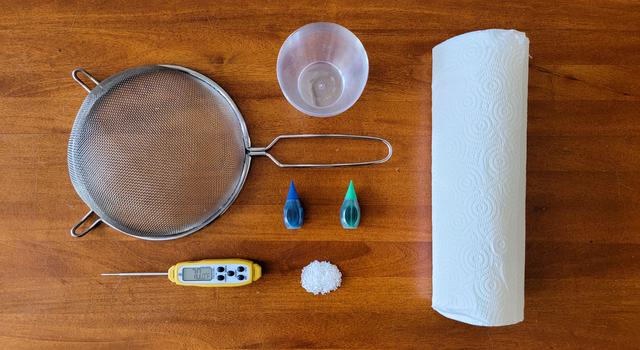
Materials
1. Think about ice
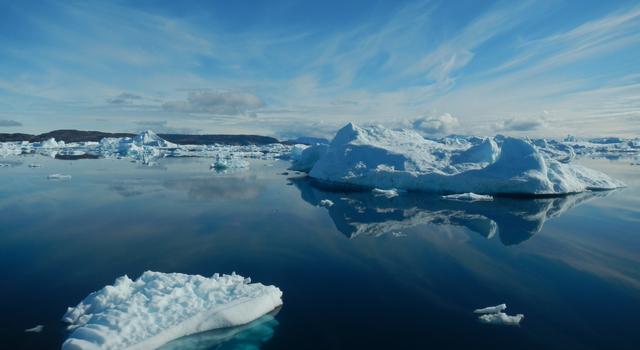
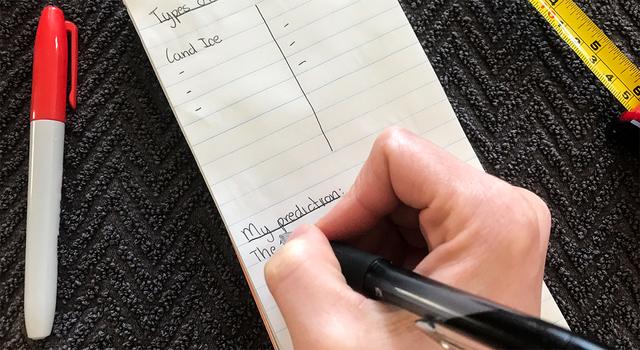
Consider where on Earth ice naturally occurs. Make a list of a few places where you might find ice in nature, and sort it into two categories: ice that is on land and ice that is in the sea.
2. Make a prediction
On the data sheet or a blank piece of paper, write down your prediction for which type of ice – land ice or sea ice – contributes more to sea level rise.
3. Set up your experiment
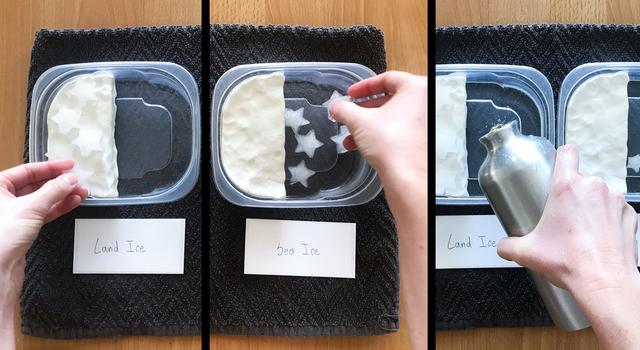
- Press equal amounts of clay into one side of both plastic containers, making a smooth, flat surface representing land rising out of the ocean. If you don’t have clay, try using some rocks to create a “land” surface on which you can place several ice cubes.
- In one container, place as many ice cubes as possible on the flat clay or rock surface. This represents land ice.
- In the other container, place the same number of ice cubes on the bottom of the container, next to the clay. This represents sea ice.
- Pour cold water into the sea-ice container until the ice floats. Be sure no ice is resting on the bottom of the container and that the water isn't higher than the land level.
- Without disturbing the ice cubes, pour water into the land-ice container until the water level is about equal to the water level in the sea-ice container.
4. Begin your observations
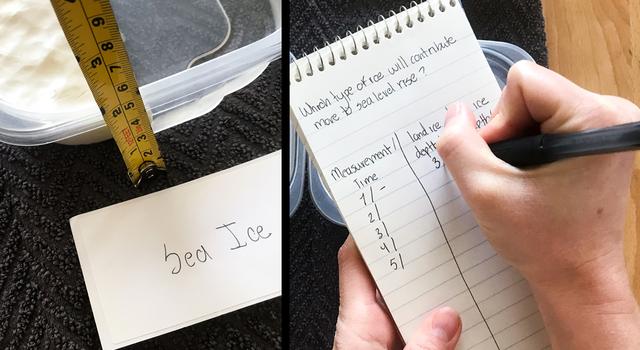
- Using the ruler, measure the water level (in millimeters) in each container and record the data on your data sheet or piece of paper.
- You can mark the water level with a marker on the outside of the container, but remember the ink might not come off. Another way to mark the water level is to make a line in the clay using a pencil or other object.
- At regular intervals – maybe every minute or five minutes – measure the water level in each container again and record it on the data sheet. Compare the water level with the marked line on the side of the container or in the clay. Allow the ice in both tubs to melt completely.
- Use the measurements recorded on the data sheet to create a line graph representing the water level in each tub. You can do this using paper or on a computer with spreadsheet software.
5. Draw a conclusion
Think about what your observations mean for melting ice around the planet and how it contributes to sea level rise. Try to answer these questions:
- In which container did the water level rise more?
- How does this compare to your prediction?
- Why do you think this occurred?
- Does the melting of Earth’s glaciers on land contribute to sea level rise?
- How about the melting of icebergs at sea?
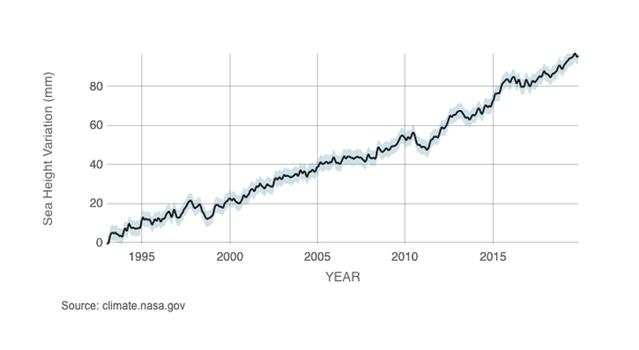
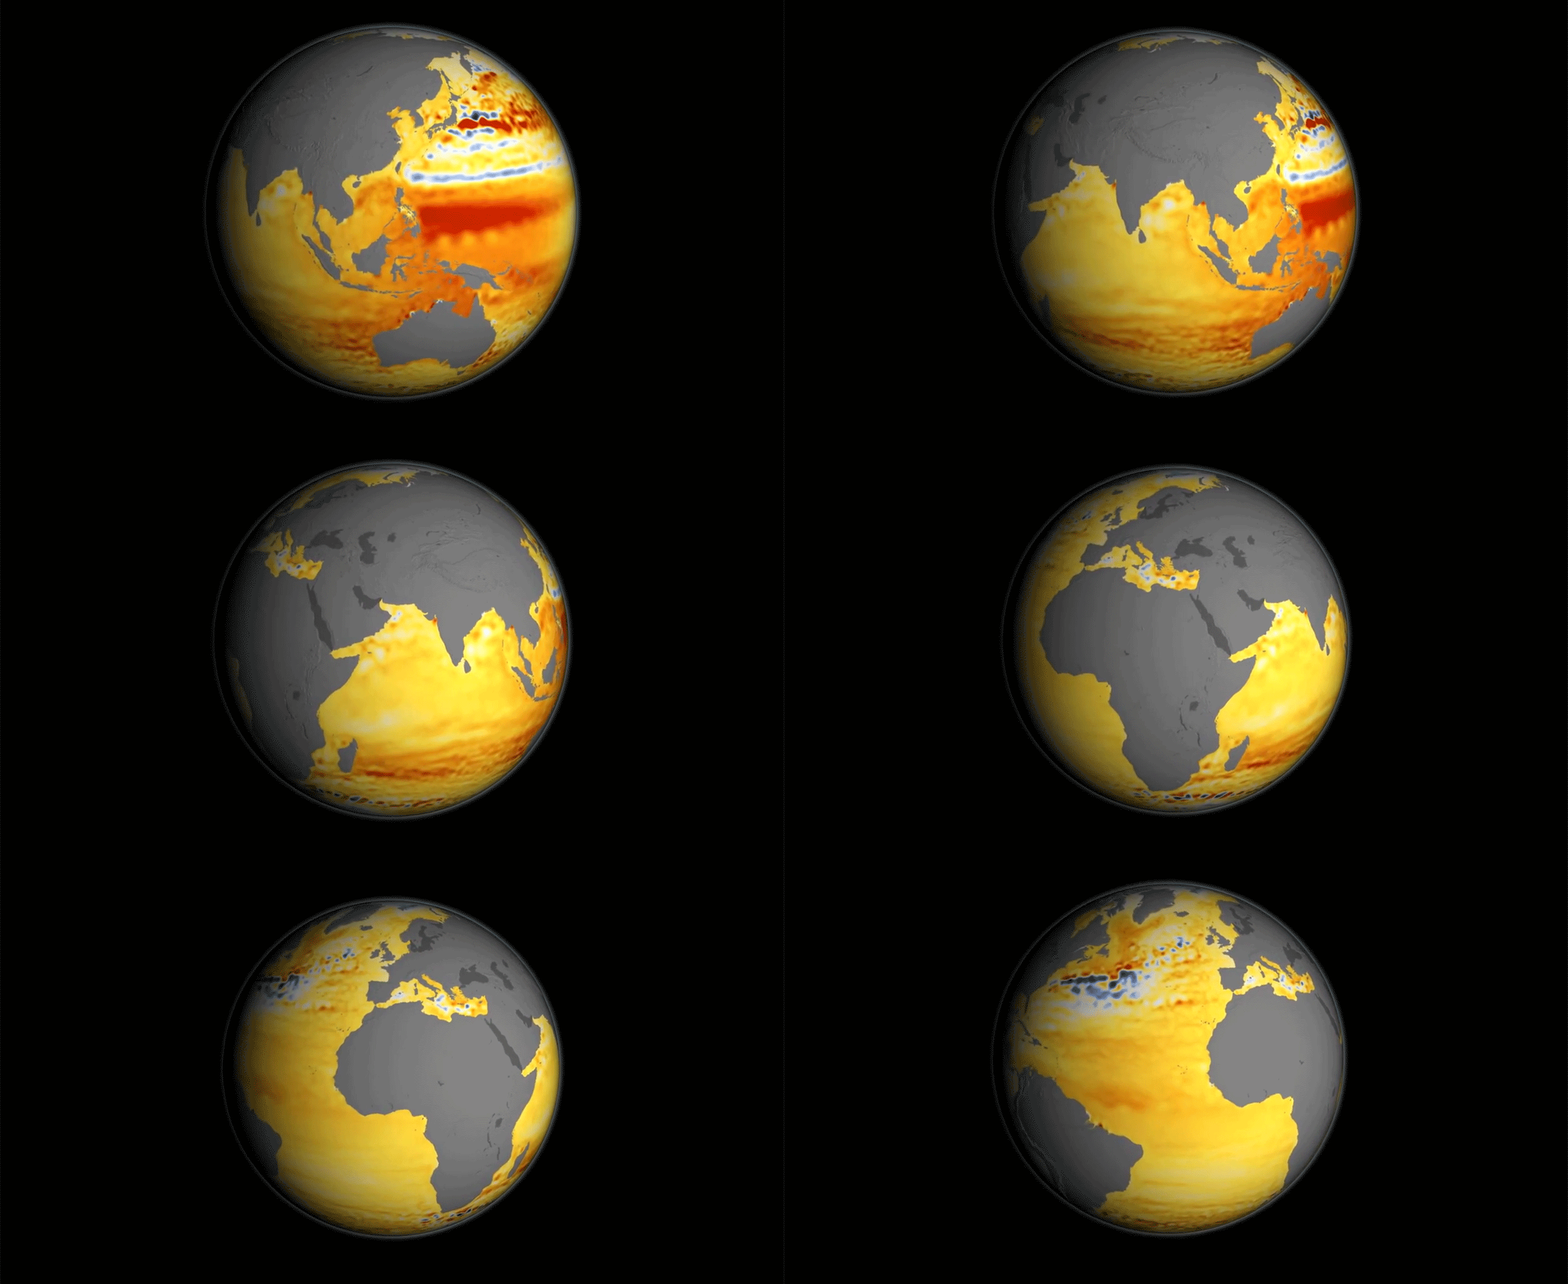
About the image: The graph above shows global sea level rise as measured by Earth satellites from 1993 through 2020. See the latest trends and explore more vital signs on the NASA Climate website.
6. Explore more!
Visit some of these websites to learn more about sea level rise and climate change:
- NASA Climate Kids
- NASA Climate website
- NASA Sea Level Rise website
- Sea Level Rise infographic


