


Classroom Activity
Studying Rocks on Mars Using Light


Overview
When exploring Mars using robotic rovers, we need to be creative about how we perform experiments remotely. One way to do this is using spectroscopy – the study of light. Rovers can excite samples of rocks on Mars and measure the light emitted. Then, they send that data back to Earth for further analysis.
Using known rock samples for comparison, students can do their own spectral analysis to determine what elements make up the rocks we expect rovers to find on Mars.
Materials
Management
- Students should be familiar with emission and absorption spectra as electrons move between atomic orbitals and emit or absorb energy. The tool used to measure this light is called a spectrometer. It can be used to collect data at numerous wavelengths and investigate properties such as the elemental composition of a sample or the vibrations of molecules.
- Before introducing the activity to students, prepare or identify several (three to five) samples of commonly available lab salts that emit bright colors when burned. These chemicals can be found by searching online for "flame ionization test" and determining what colors you can create using the supplies you have on hand. For example, compounds containing strontium burn bright red, iron compounds burn bright yellow, and nickel compounds will give off a green flame.
- Safety: This activity requires the use of an open flame to burn various salts soaked in alcohol. As is the case with any open flame, be certain to wear goggles, long sleeves, and flame-resistant gloves. Don’t forget to comply with your school’s safety rules and regulations and provide personal protective equipment for students considered in the "danger zone," should any splash occur. The use of a safety barrier between the demonstration and students could help mitigate any hazards. Teachers should lead the demonstration portion that requires the flame while students are observing and taking notes.
- Teachers should prepare an “unknown Martian rock sample” in advance of the demonstration to model how students can use the color of the light to predict the elements in the unknown sample. This sample can be created using a borax detergent, which burns a distinct yellow-green color due to the boron contained in the powder.
- If needed for accessibility, machine readable versions of the graphs in this lesson and on the student worksheet are available for download as an Excel spreadsheet from the materials list. The raw data used to compile the graphs can also be found on the Google Sheets link in Materials.
Background
For the first time, NASA has two rovers actively exploring different parts of the Red Planet using similar techniques to study the geological structure of Mars. Curiosity’s exploration of Gale crater and Perseverance’s journey through Jezero crater provide an opportunity to compare and contrast rocks and minerals from two distinct locations on Mars using spectroscopy, or the study of light.
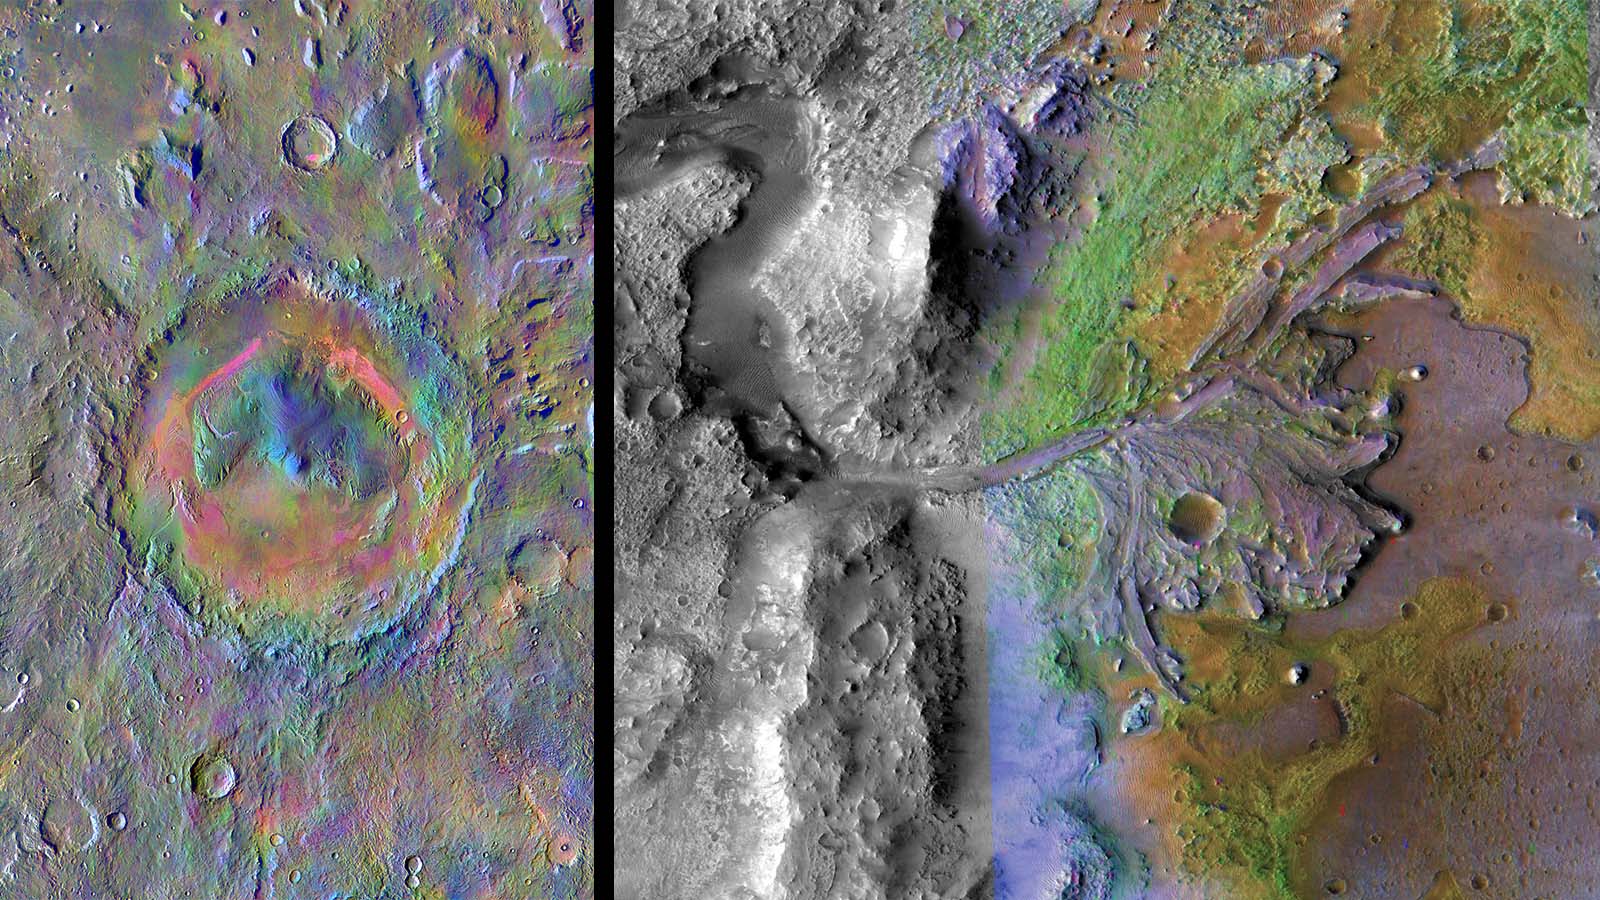
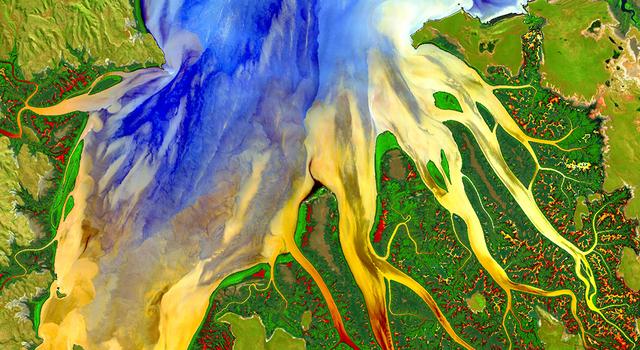
These satellite images of the Curiosity and Perseverance Mars rover landing sites in Gale and Jezero craters, respectively, have been colored to show the presence of various minerals at each location. Credit: NASA/JPL-Caltech | › Full image and caption: Left image (Gale crater) | Right image (Jezero crater)
The rovers use a suite of advanced science tools, or instruments, to study the objects they encounter. While the rovers are equipped with numerous complex instruments, much of the science relies on collecting light, whether it be from the cameras detecting visible light, or wavelengths from outside of what we can see with the naked eye. One such instrument is capable of collecting data using wavelengths of light produced by interaction of energy with rocks and soil. It can then produce spectra, or representations of that light in a more quantitative form, so scientists can better understand Martian targets of interest.
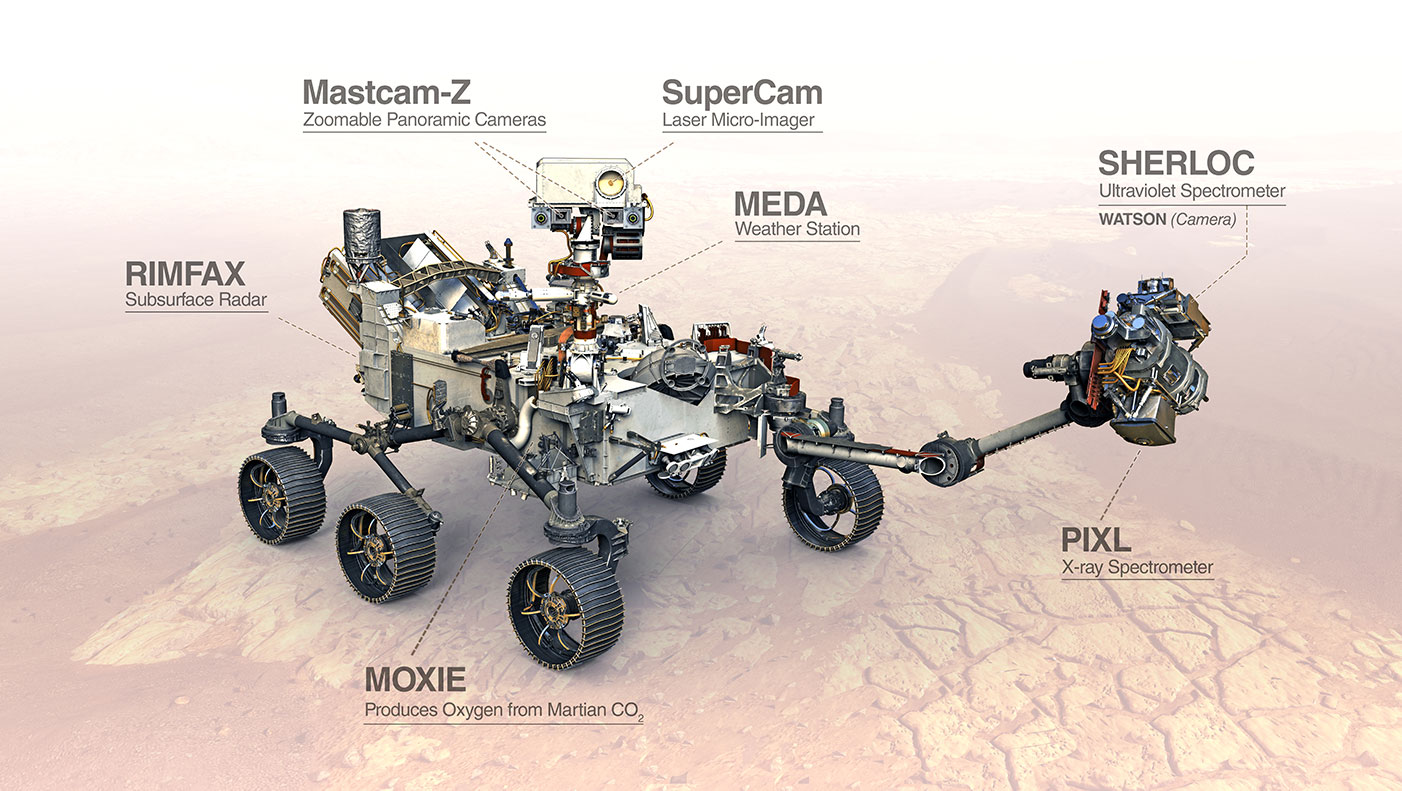
This artist's concept shows the various science tools, or instruments, aboard the Perseverance Mars rover. The SuperCam instrument uses laser-induced breakdown spectroscopy, or LIBS, to anaylze samples on Mars. The Curiosity rover has a similar instrument called ChemCam. Image credit: NASA/JPL-Caltech | › Learn more about the rover's science instruments
This technique, used on both of the rovers, is called laser-induced breakdown spectroscopy, or LIBS. This kind of spectroscopy is performed by firing a focused infrared laser beam from the mast of the rover. The laser heats the target sample to as high as 10,000 degrees Celsius (more than 18,000 degrees Fahrenheit), which causes the rock sample to emit a plasma. A spectrometer aboard the rover then measures the light emitted from the plasma.
In this Mars Report from June 2021, Hemani Kalucha with the Perseverance rover's SuperCam operations team provides an update about how the rover is analyzing rocks using LIBS. Credit: NASA/JPL-Caltech | Watch on YouTube
The light is emitted suddenly and can often be complex due to the wide range of elements and compounds that make up the geology of Mars. To better understand the light emitted during LIBS, NASA has prepared calibration targets to serve as a reference point that's based on our current understanding of Martian geology.
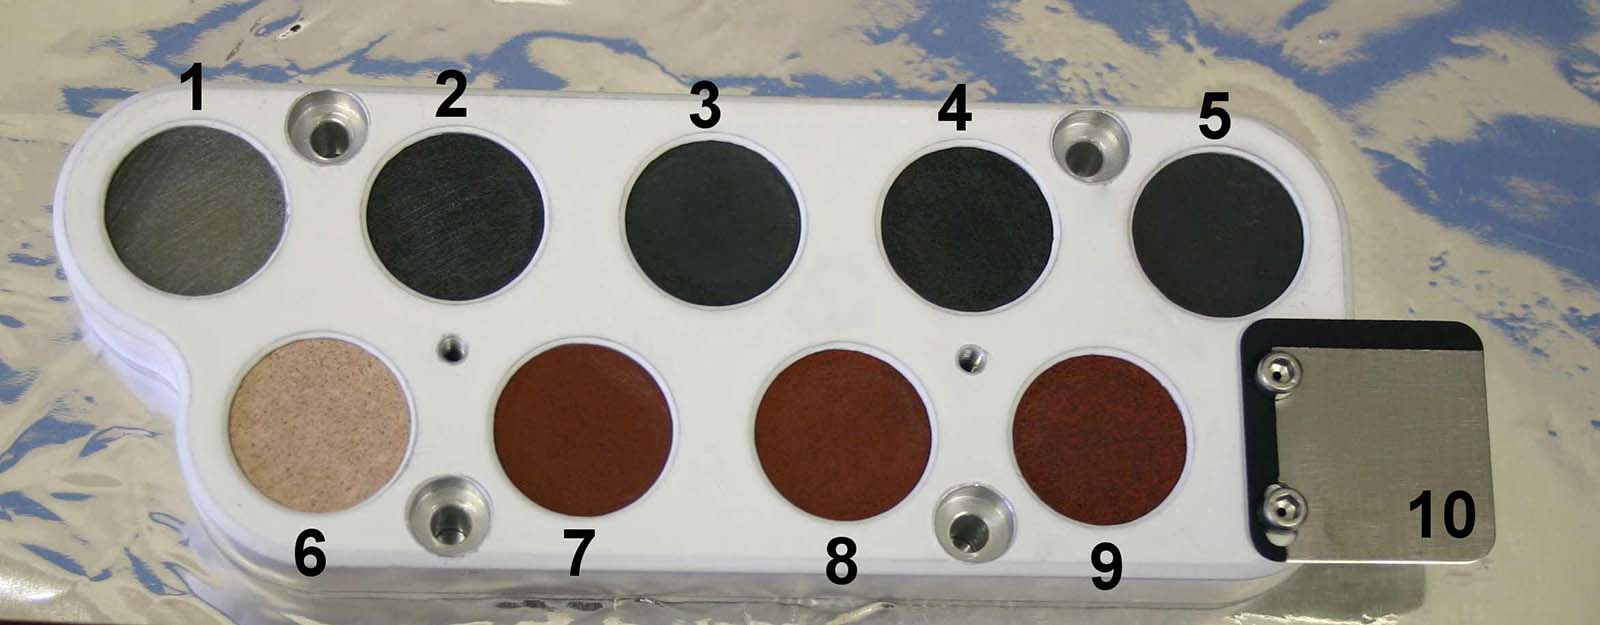
Each rover is equipped with a palette of calibration targets, like the one shown here on the Curiosity Mars rover. The palettes consist of thin samples of rocks from Earth that we believe represent the types of igneous rocks (top row) and sedimentary rocks (bottom row) we expect to find on Mars. Credit: NASA/JPL-Caltech/LANL | › Full image and caption
To create this library of spectra that could be used to identify rocks encountered by the rovers on Mars, scientists performed countless tests using LIBS on different elements from the periodic table and known rocks on Earth.
Using these techniques, Curiosity, which landed on Mars in 2012, and Perseverance, which landed in 2021, are providing scientists with a deeper look into the geologic history of two separate regions on the Red Planet.
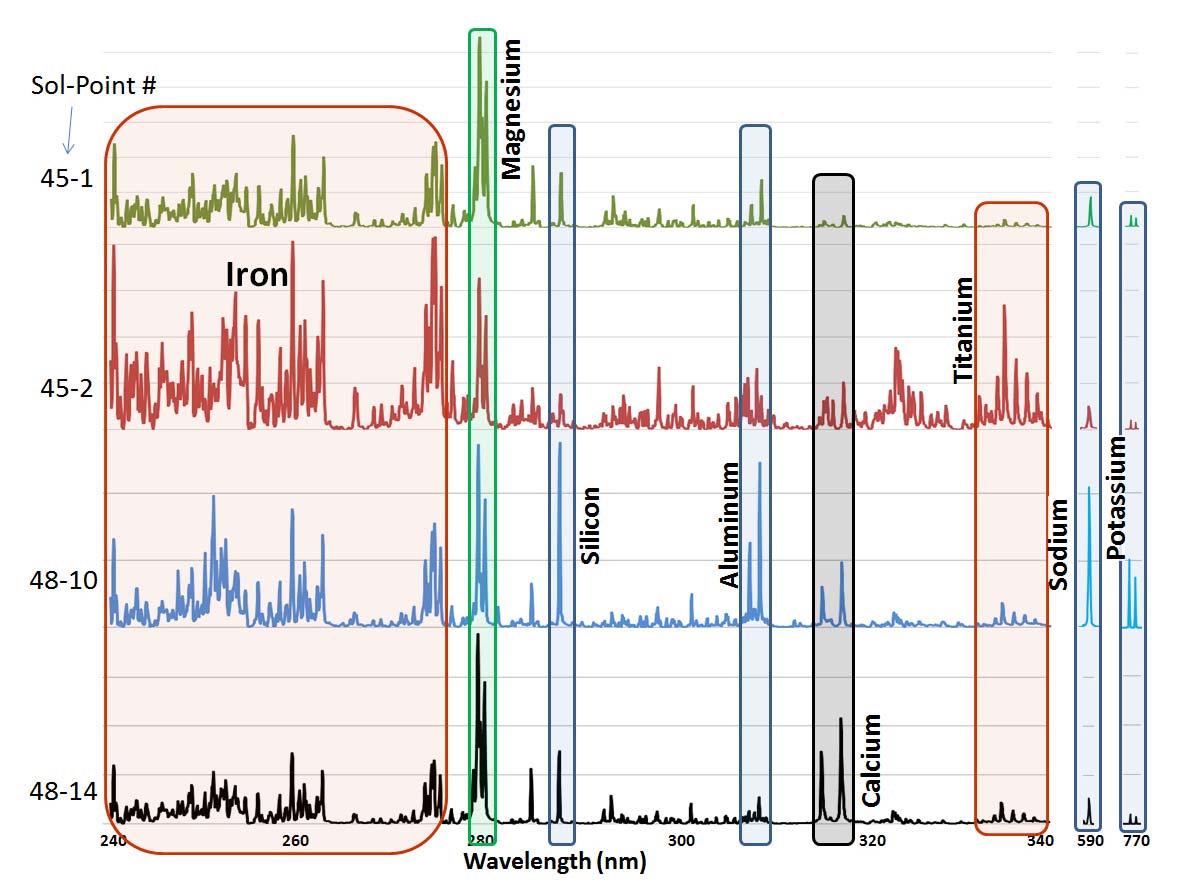
This graphic made from data obtained by NASA's Curiosity rover shows the ultraviolet portion of the spectrum of data obtained by the Chemistry and Camera (ChemCam) instrument, plus peaks for sodium and potassium, for four observation points on the rock "Jake Matijevic." Chemcam analyzed a total of 14 points on the rock, zapping each one 30 times with its laser. Credit: NASA/JPL-Caltech/LANL/IRAP | › Full image and caption
For example, while climbing Mt. Sharp, Curiosity found potassium-rich sandstone, suggesting a high deposition of sediments, like wind-blown sand, and uplift of the surface over time.
Meanwhile, scientists believe that Jezero Crater, where Perseverance landed, will host numerous types of olivines and carbonates, which are associated with bodies of water on Earth. The carbonates are of particular interest due to their ability to preserve biosignatures – signs of ancient life.
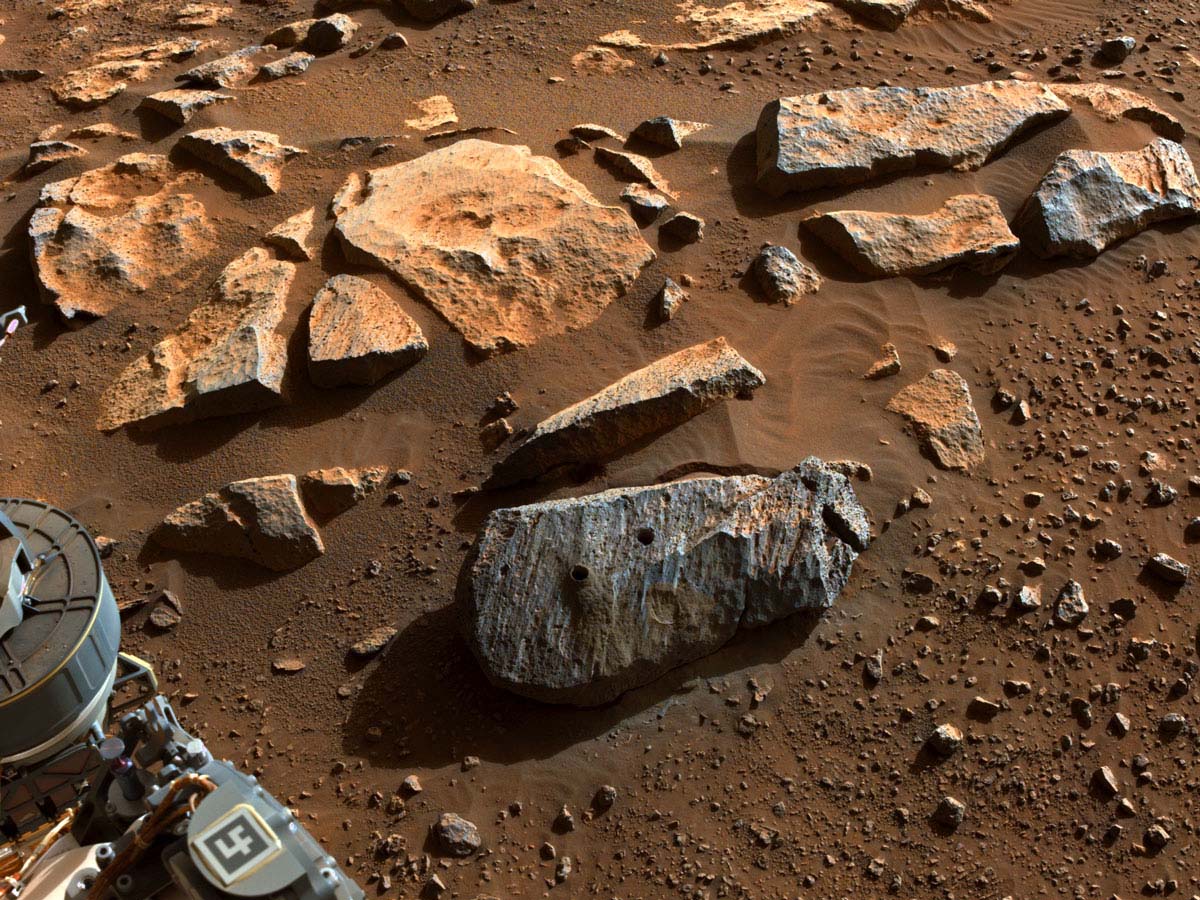
This image taken by NASA's Perseverance Mars rover on Sept. 7, 2021, shows two holes where the rover's drill obtained chalk-size samples from a rock nicknamed "Rochette." Credit: NASA/JPL-Caltech | › Full image and caption
NASA scientists will be looking closely at the spectra of these rocks to see which elements are present, such as silica and carbon, along with various metals.
Likewise, in this activity, students can analyze similar spectra of representative rocks to help construct a more complete story of what the Red Planet looked like long ago and how it changed over geologic time.
Procedures
- Introduce the landing sites chosen for the Curiosity and Perseverance rovers at Gale crater and Jezero crater, respectively. Have students explore the reasons why each landing site was chosen from a scientific perspective, and discuss it as a class:
Each of these locations have interesting geological significance and represent opportunities to detect signs of ancient life on Mars using spectroscopy (among other techniques). Spectroscopy, or the study of light, allows scientists to measure the precise wavelengths of light that are emitted when electrons are excited in a sample of interest. While instruments such as spectrometers allow us to do this with much higher accuracy, we can model the process using the visible light spectrum by observing the colors of light emitted by various samples. - Using the samples of salts you prepared above, place 1-3 grams of each of the salts on a petri dish or watch glass and add roughly 5 mL of ethanol or rubbing alcohol to each sample.
- Using a long match or butane lighter, safely ignite the alcohol, and have students observe and record which elements create uniquely colored flames in Section 1 of their worksheet. It may help to have the lights in the classroom turned off to best see the colors being created.
- Explain to students that in the past, this technique was used to determine the presence of elements within samples, but now we have scientific instruments capable of seeing more than color – these instruments can detect the wavelength of light being emitted. And in fact, the rovers each host a palette of known samples (like the ones just used) to calibrate our instruments as we explore more complex unknown samples.
- Prepare a more complex, “unknown” sample and have students predict what elements it contains using some of the samples explored in Step 3. For example, mix a sodium sample (such as table salt, which creates a fluffy, orange flame) with a boron sample (such as borax detergent, which creates a yellow/green flame).
- Have students record their observations in Section 2 of their worksheet and predict which rover would have found a sample similar to the one presented.
For example, boron-containing samples on Mars are generally only found at Gale crater. Thus, we would then determine that a rock of this type must have been collected by the Curiosity rover. - Have students complete sections 3-5 of their worksheet, individually or in small groups. Check the Assessment section below for more information and tips on how to evaluate student work.

Examples of the different colored flames produced by various samples. Credit: NASA/JPL-Caltech | + Expand image
Discussion
- Using the light emitted from different samples allows us to match wavelengths of light (color) to known standards that we anticipate finding on Mars. However, to the human eye, some colors may overlap. Do you expect that colors would mix if multiple elements were present? Would the presence of a red-burning element and a yellow-burning element make an orange flame?
- Some colors may have shown up more easily than others. Were you able to determine the abundance of how much of each element was present using this method? How could we measure not just what elements are present, but also how much of them?
- In this experiment we used only our eyes, which means we limited ourselves to the visible-light portion of the electromagnetic spectrum. Where else in the electromagnetic spectrum could we look to learn more about our samples? What information would this give us?
Assessment
- In sections 1 and 2 of their worksheet, students should capture the element ionized and the color associated with the test. This will help them identify the “mystery element(s)” in the unknown sample. For reference, Boron, which can be found in detergents such as Borax, burns yellow. Limestone, which contains Calcium, burns a light, fluffy orange.
- Using the calibration target spectra provided in Section 3 of their worksheet, have students determine what elements are contained within the three unknown samples in Section 4. These samples are very similar rocks, all containing calcium. However the dolomite sample also contains magnesium, and the ankerite sample contains both magnesium and iron. Students should be able to identify the presence or absence of each element. Note: In the graphs below, different elements show up with different relative intensities, so some peaks may not be as tall or as sharp as others. The yellow and orange highlighted areas indicate the presence of iron and magnesium, respectively.
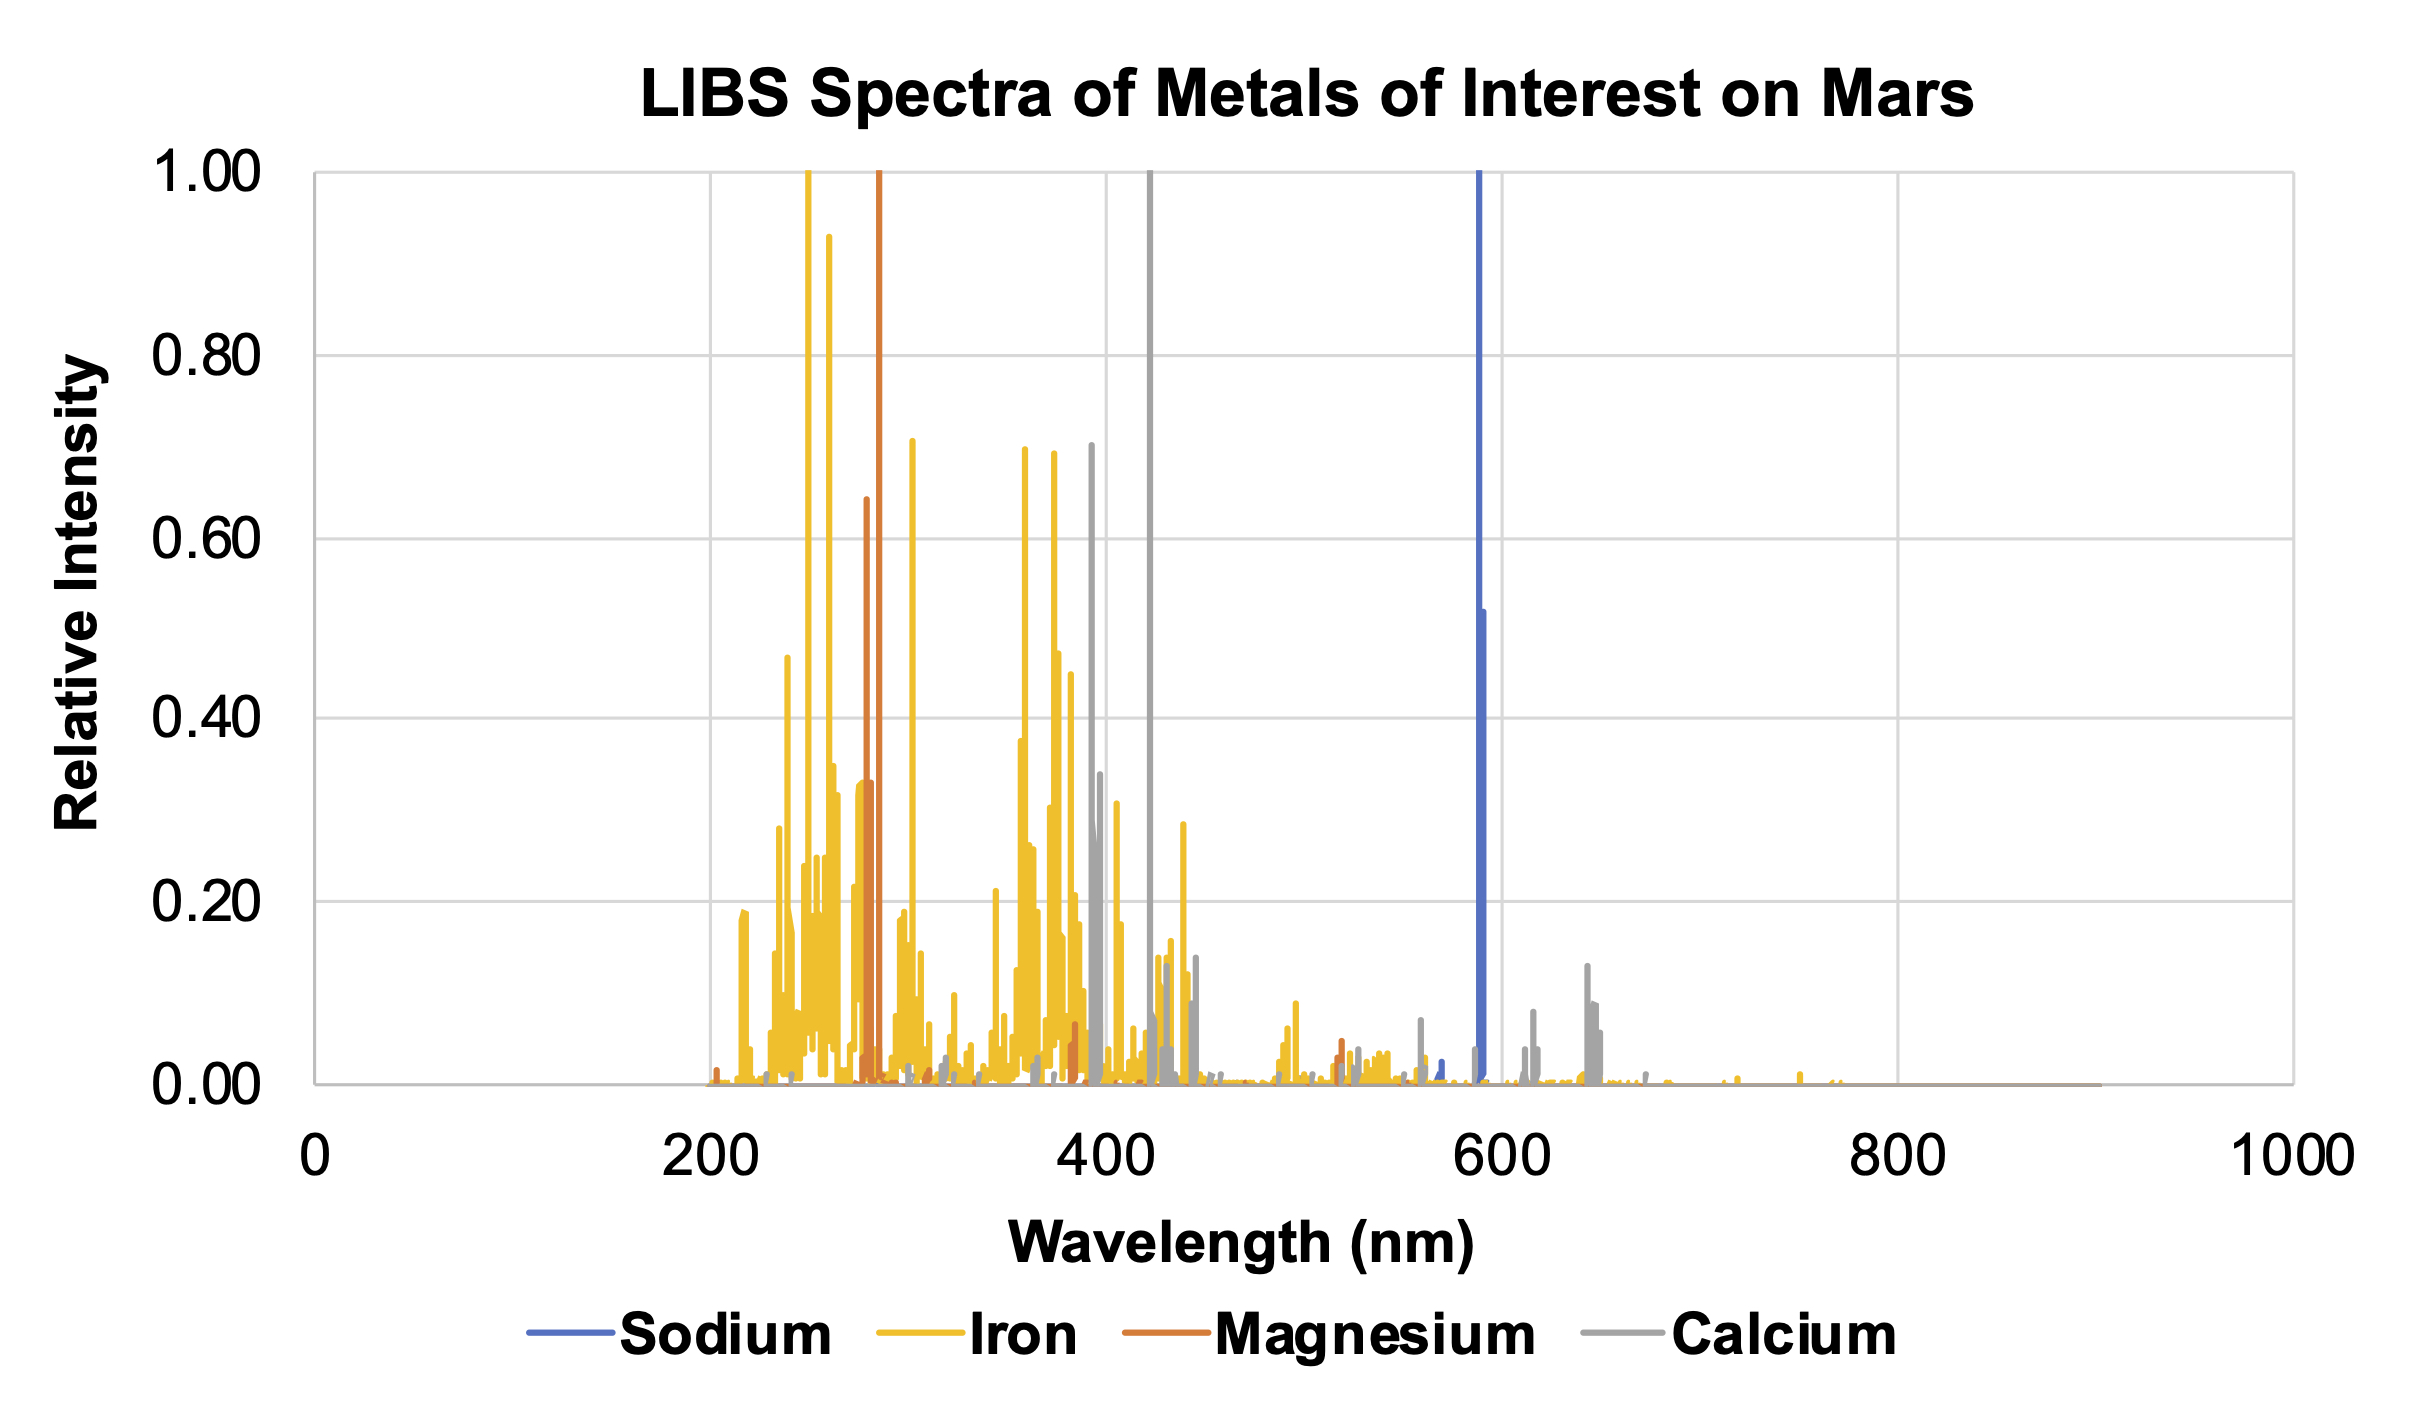
Spectra of metals of interest on Mars. Credit: NASA/JPL-Caltech | + Expand image| › Download machine readable graph (XLSX - 10 MB)
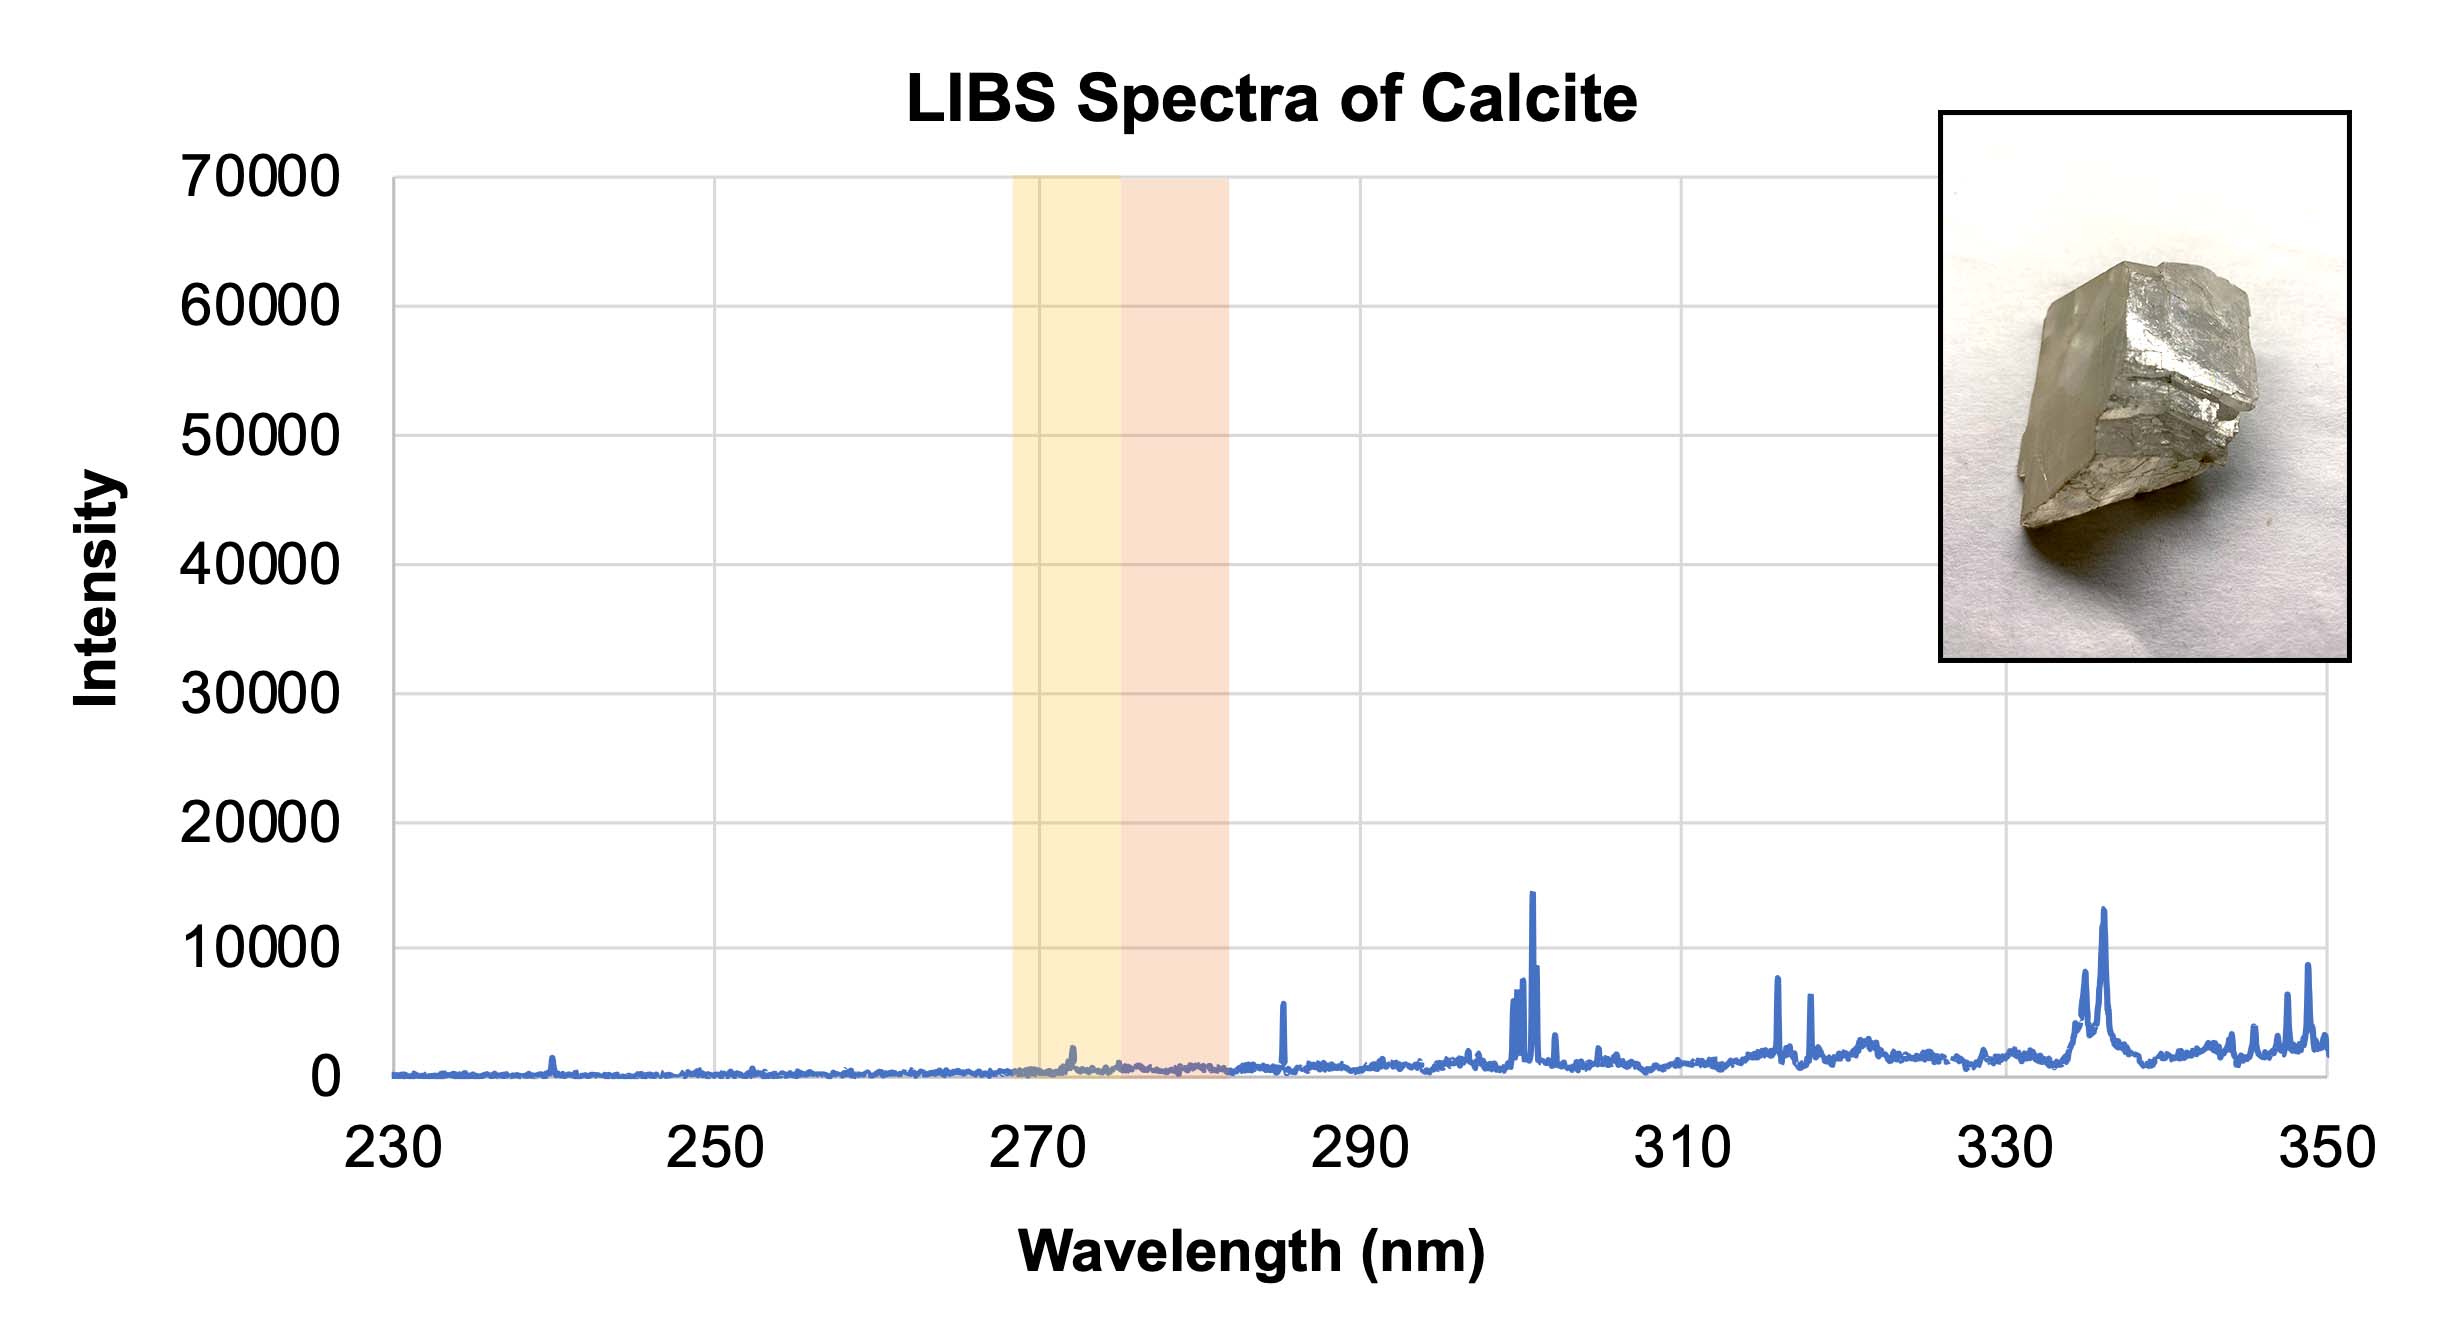
LIBS spectra of calcite with an inset showing a representative sample of calcite. Credit: NASA/JPL-Caltech | + Expand image | › Download machine readable graph (XLSX - 10 MB)
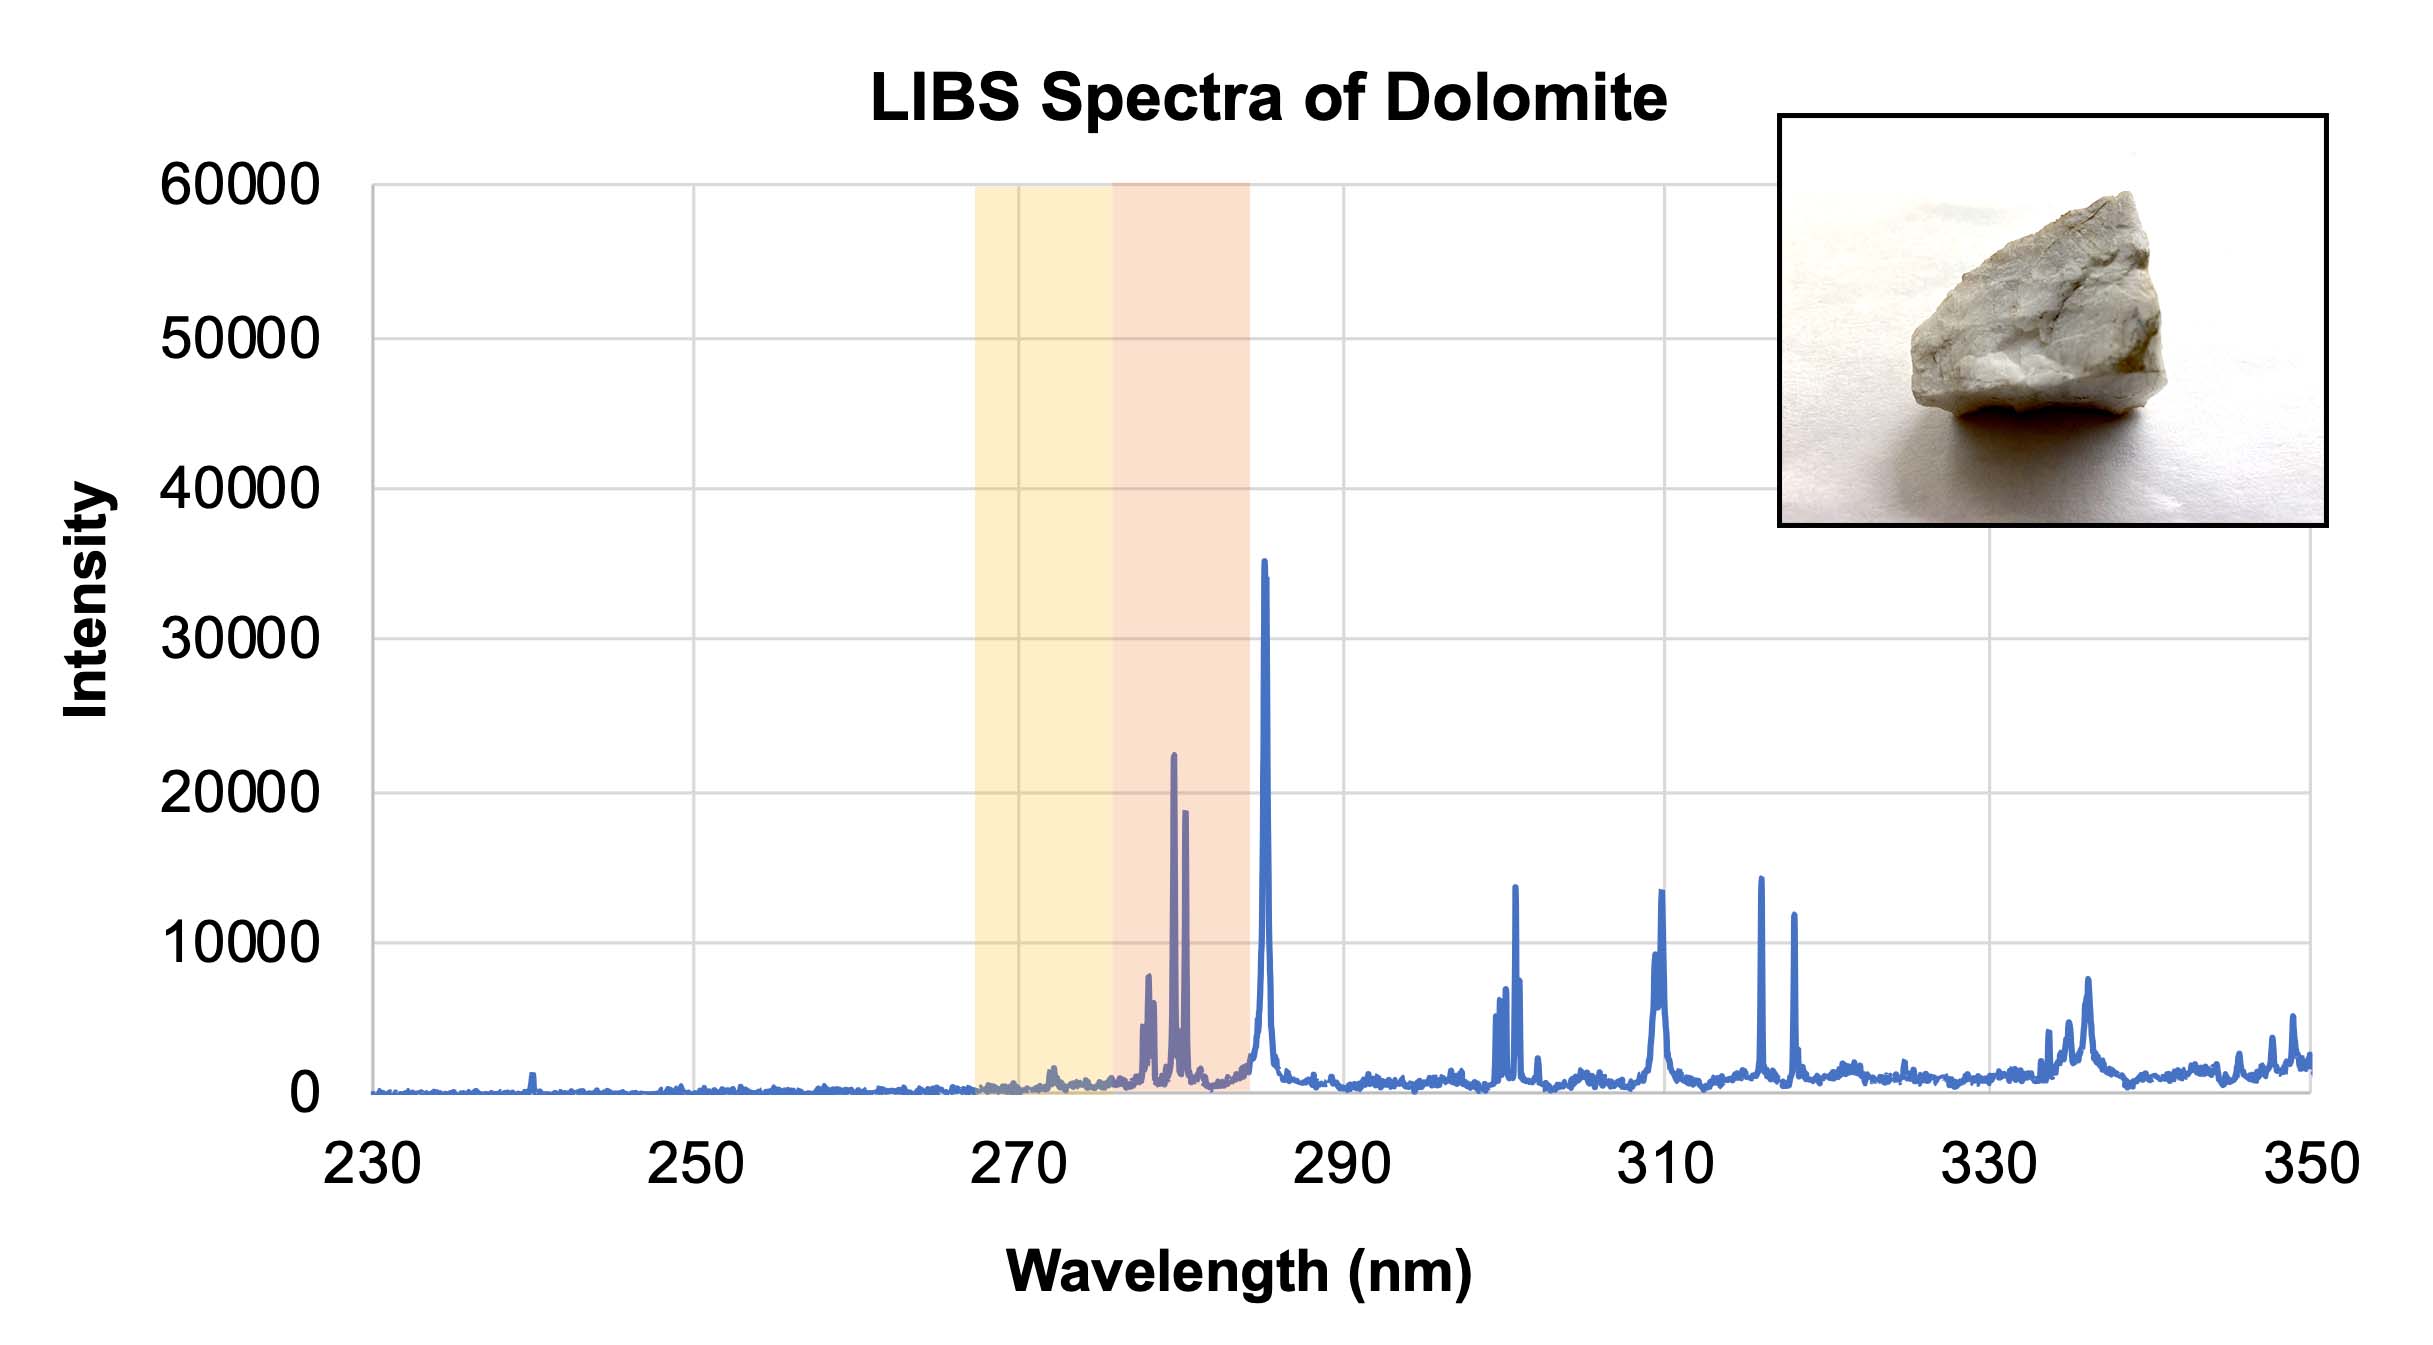
LIBS spectra of dolomite with an inset showing a representative sample of dolomite. Credit: NASA/JPL-Caltech | + Expand image | › Download machine readable graph (XLSX - 10 MB)
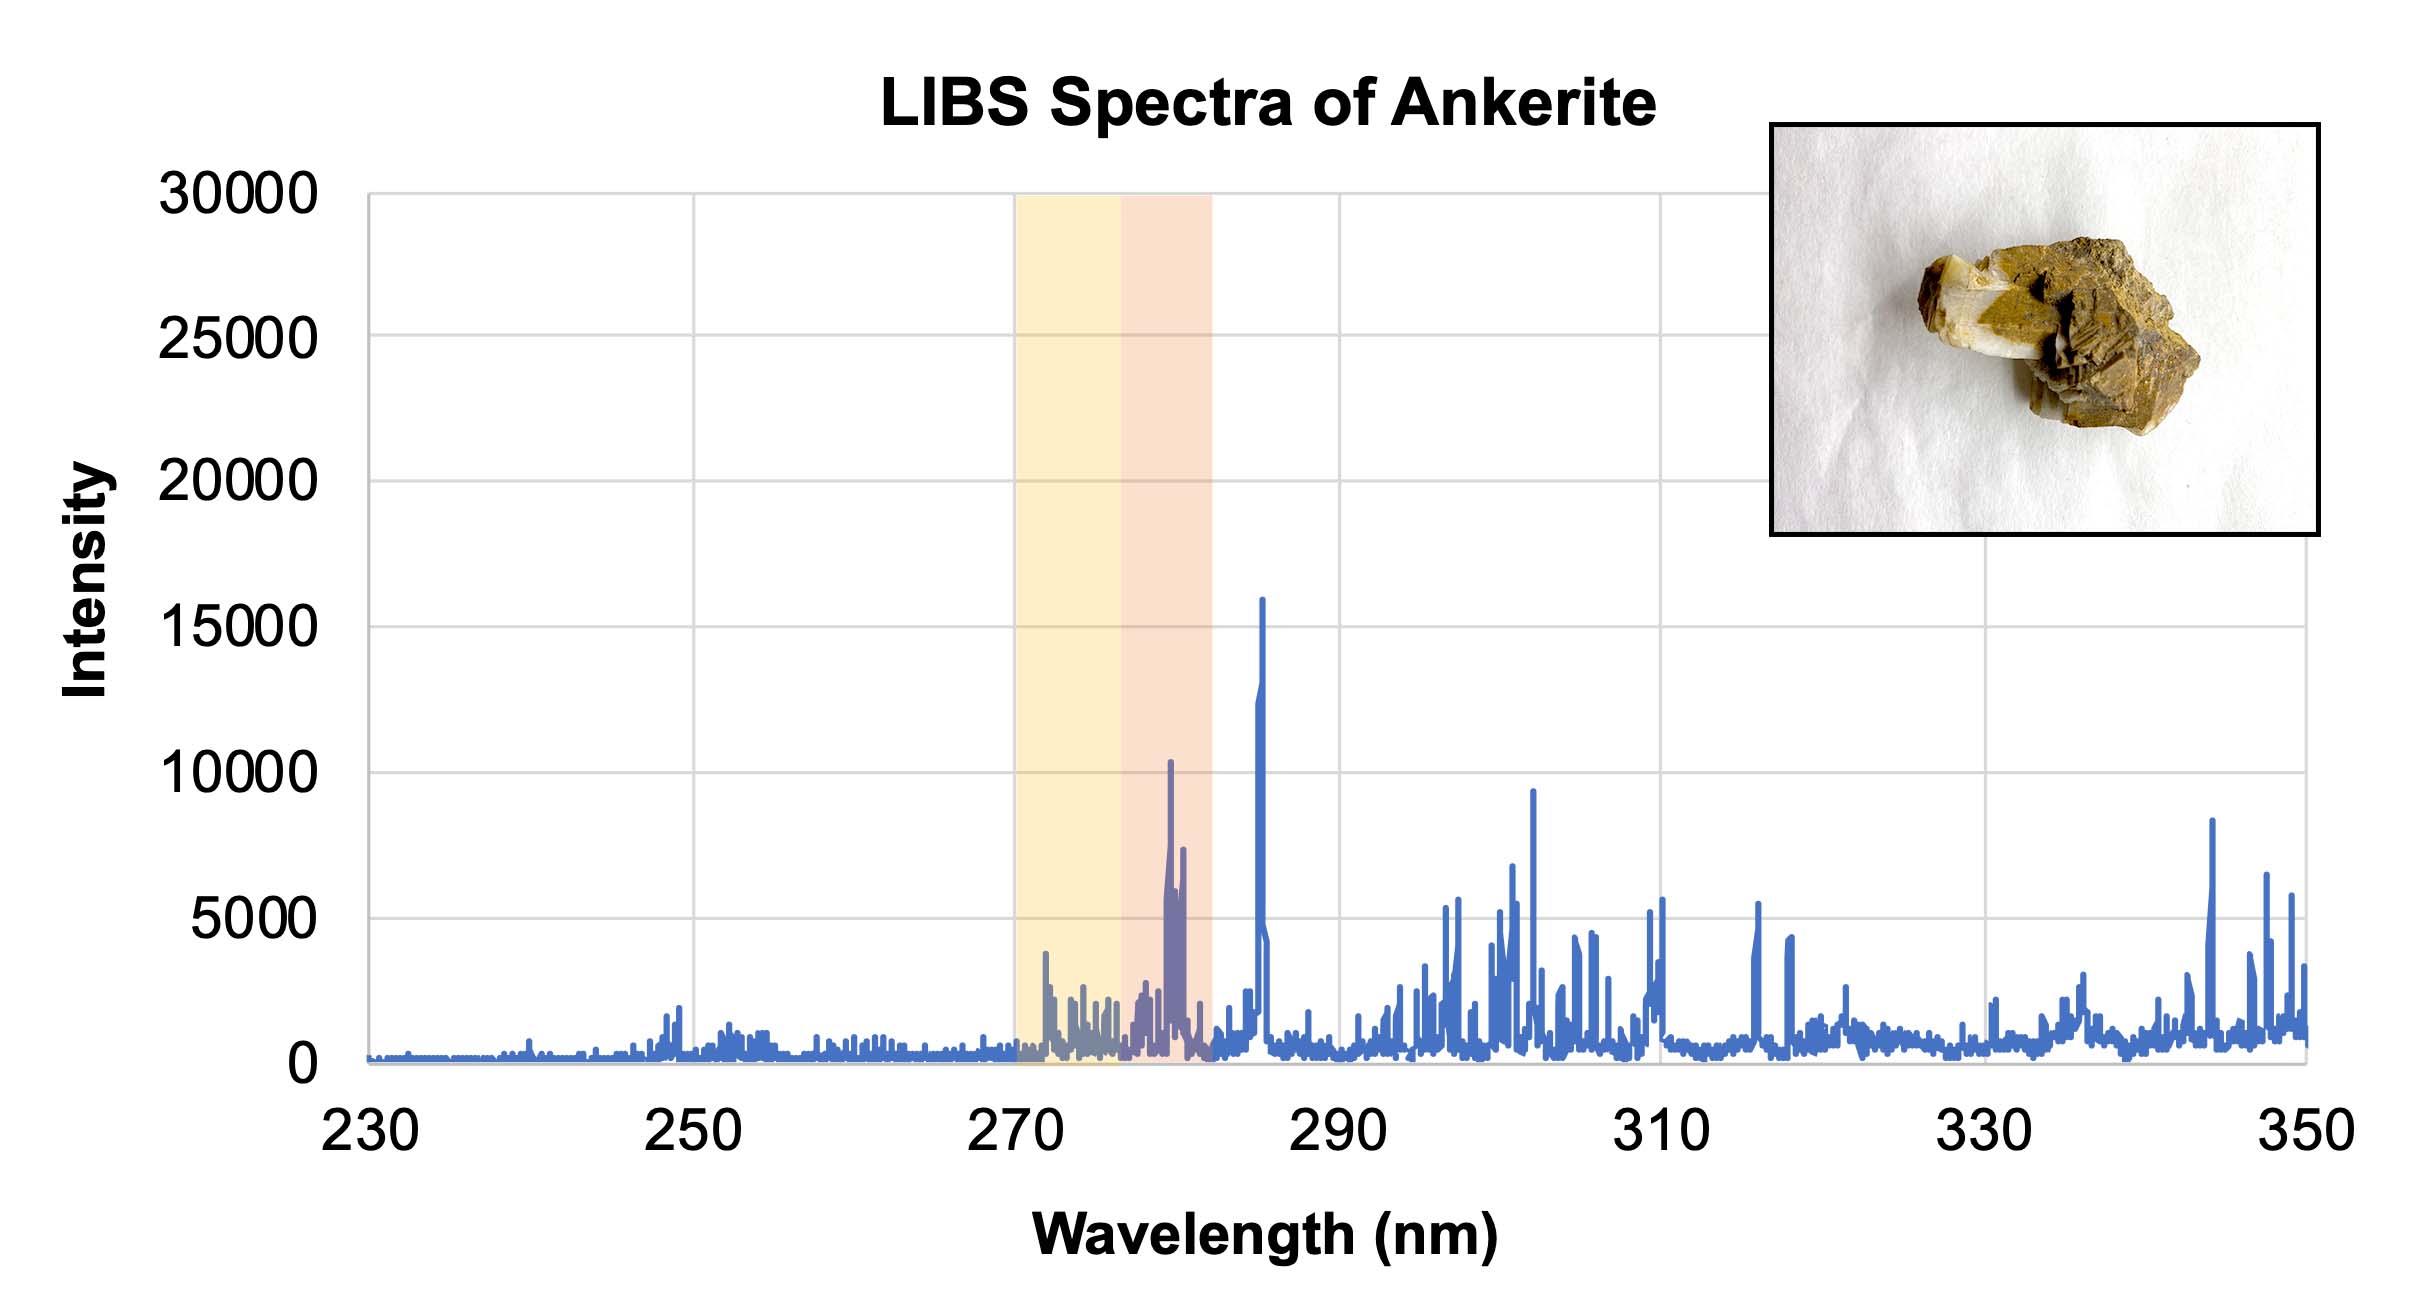
LIBS spectra of ankerite with an inset showing a representative sample of ankerite. Credit: NASA/JPL-Caltech | + Expand image | › Download machine readable graph (XLSX - 10 MB)
- In Section 5 of the worksheet, two samples are presented. One was analyzed by the Curiosity rover at Gale crater and the other was analyzed by the Perseverance rover at Jezero crater. Have students predict which elements are in each sample, and if possible, which rover would have collected the sample. The information provided in the Background section can help students deduce the latter. They should note the presence of iron and magnesium in both samples, but olivine will also have silicon (the peaks at 300) since it is a silicate rock as opposed to a carbonate. Students may predict the magnesite also contains aluminum or calcium (peak at 300).
- A sample answer key can be found in the materials list above.
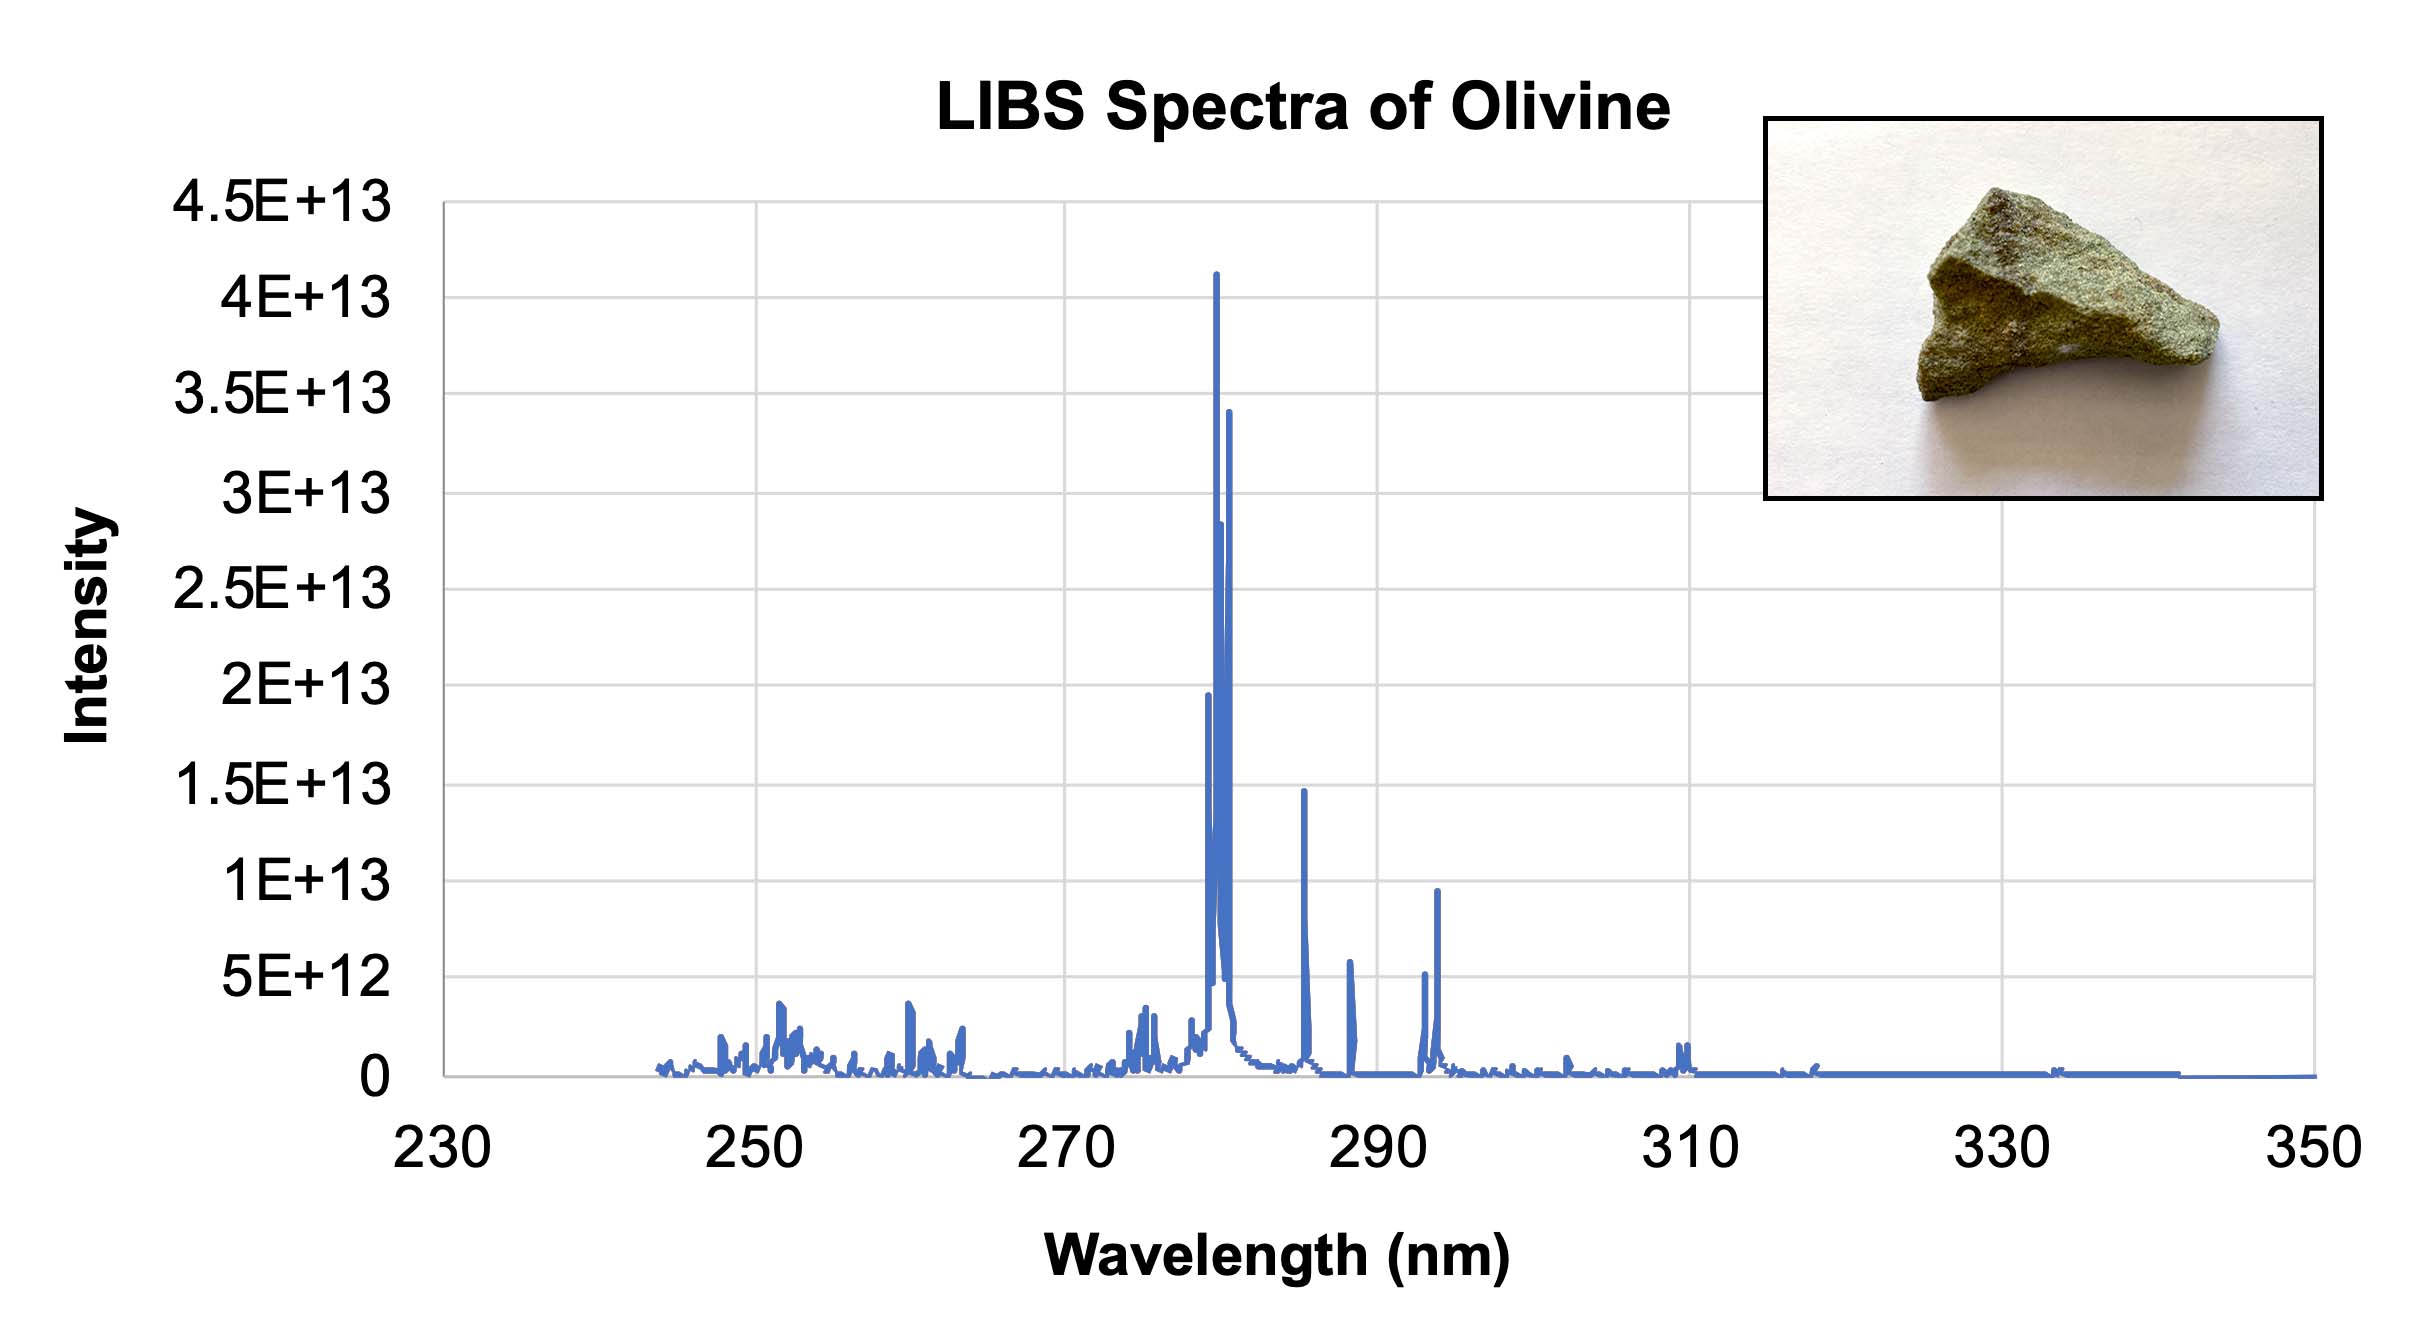
LIBS spectra of olivine with an inset showing a representative sample of olivine. Credit: NASA/JPL-Caltech | + Expand image | › Download machine readable graph (XLSX - 10 MB)
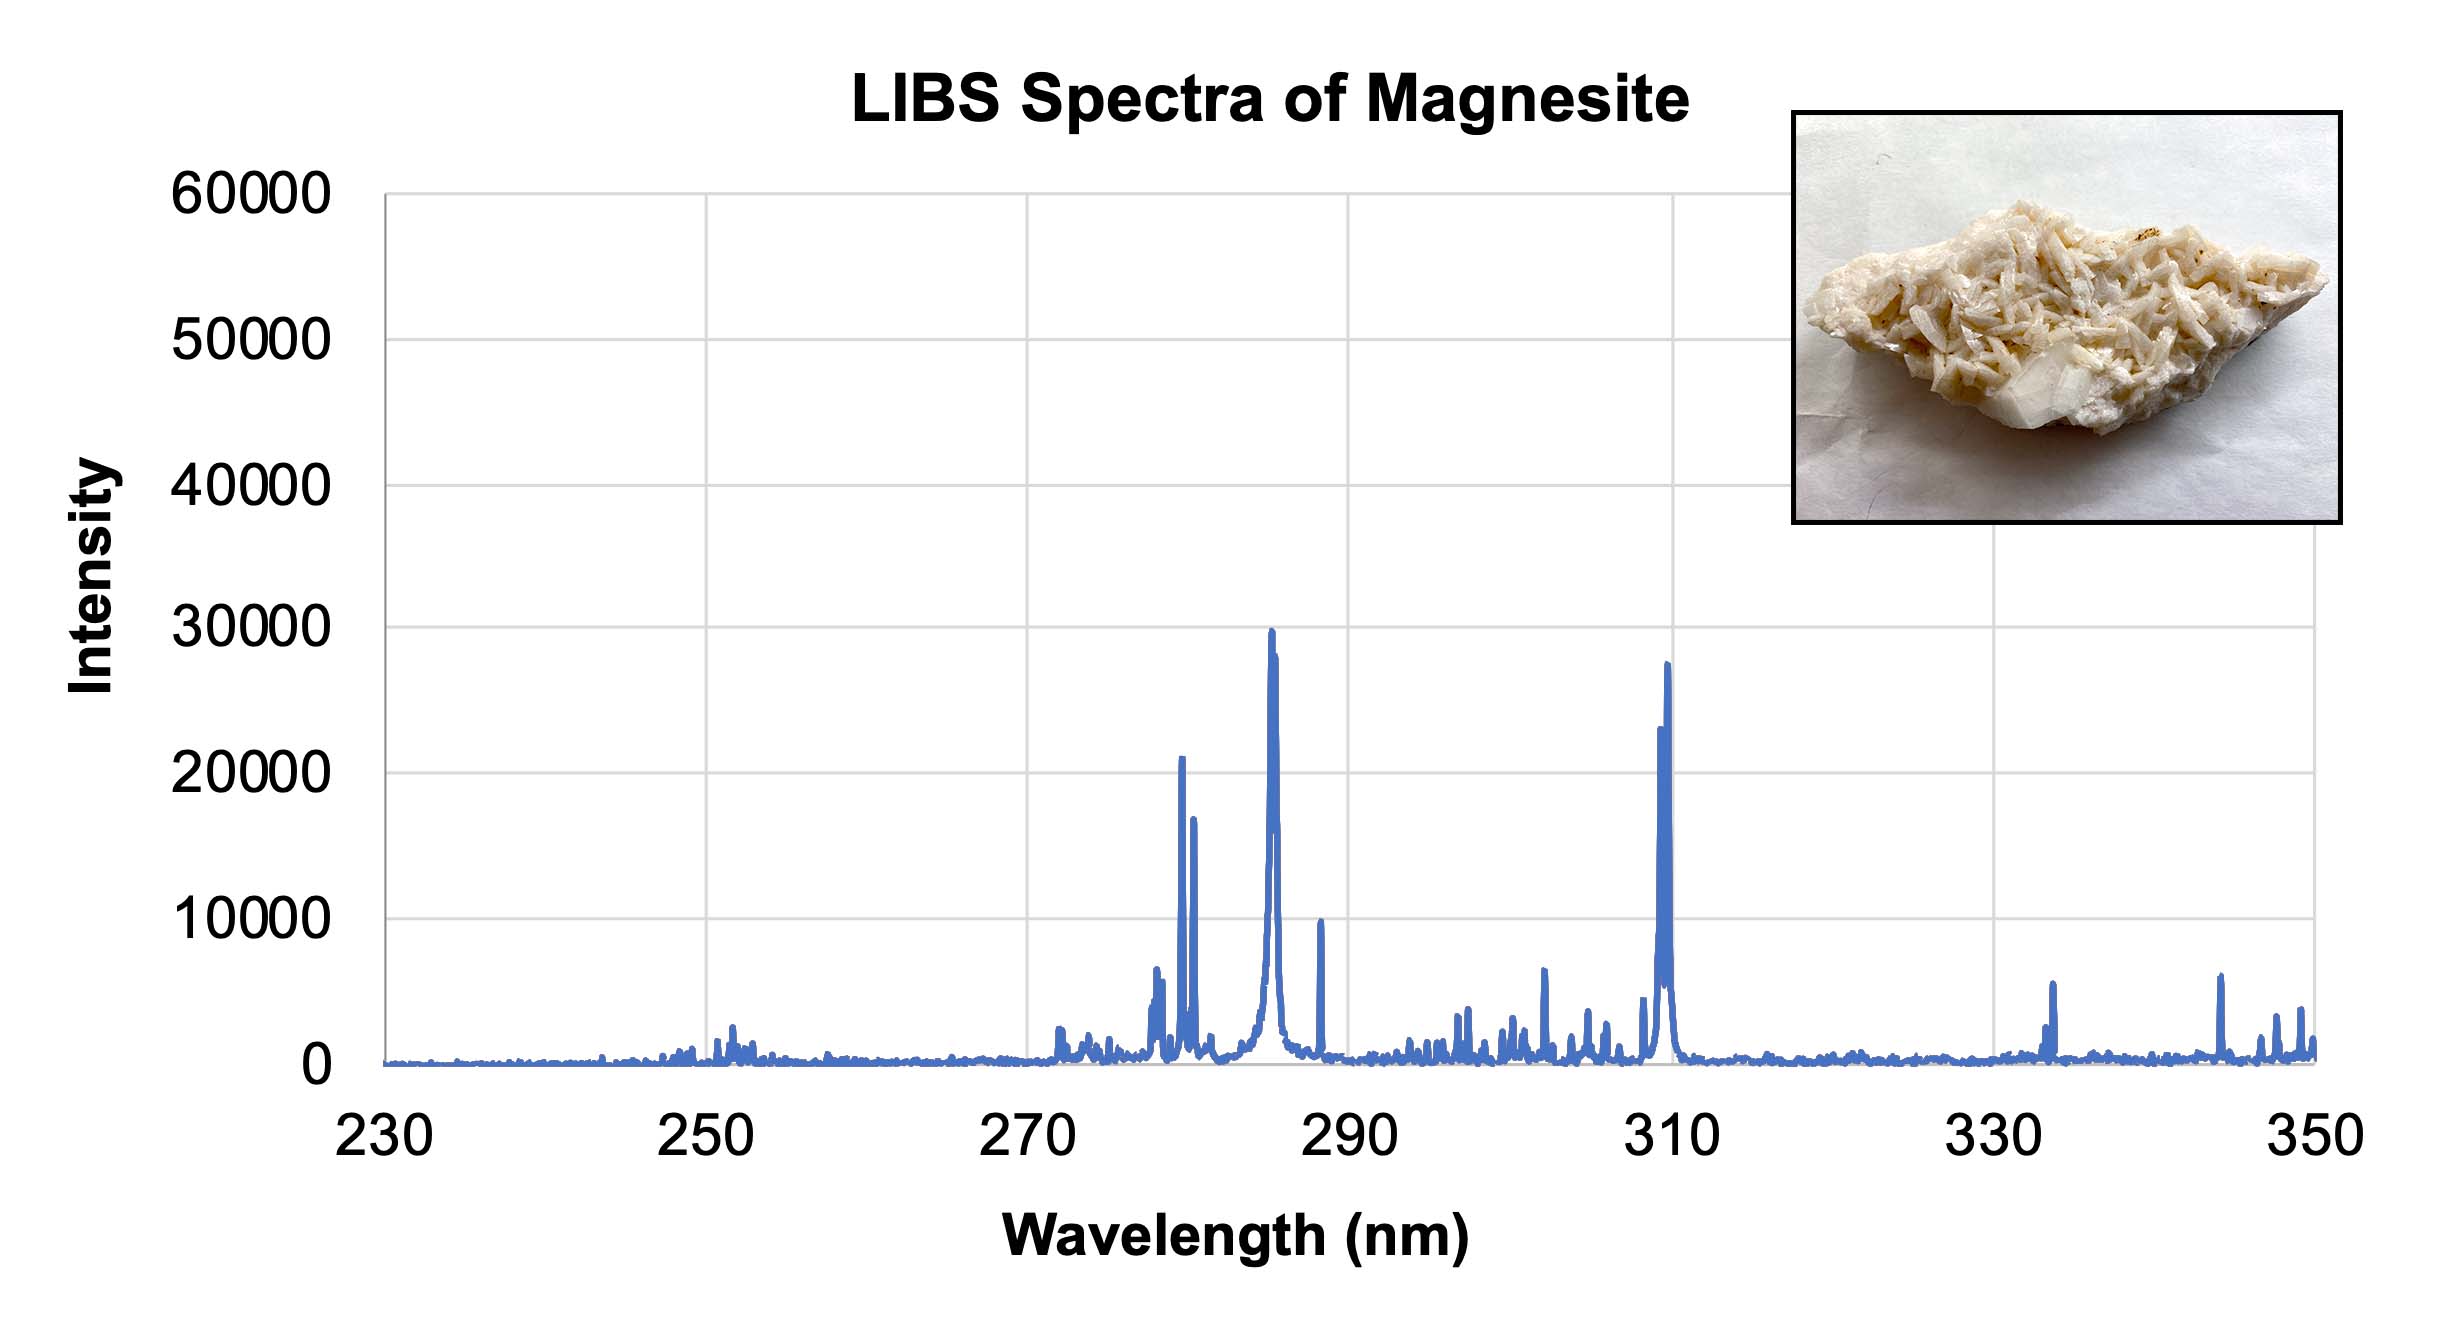
LIBS spectra of magnesite with an inset showing a representative sample of magnesite. Credit: NASA/JPL-Caltech | + Expand image | › Download machine readable graph (XLSX - 10 MB)
Extensions
Chemistry allows us to see what elements are contained within the rock samples rovers analyze on Mars. But to better understand how those atoms are arranged into larger structures, we need to turn to geology. To construct the atoms into macromolecules of rocks and minerals, students can create 3-D structures of these samples in the following lesson:

Explore More
Educator Guides
Student Activities
-
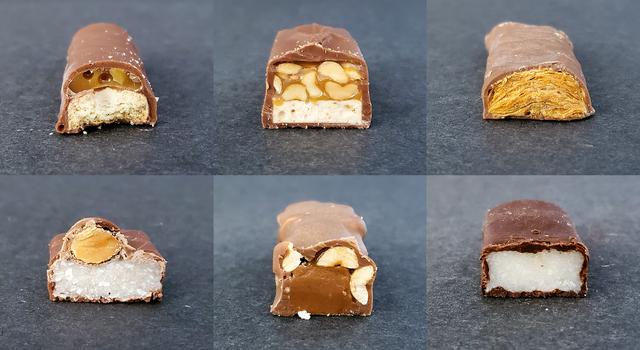
Describe Rocks Like a NASA Scientist
Learn how to describe rock samples like a NASA scientist. Then, take a quiz to see if you can match edible rocks made of candy bars – and real rocks from Earth and space – to the correct description.
Subject Science
Grades 4-8
Time 30-60 mins
-
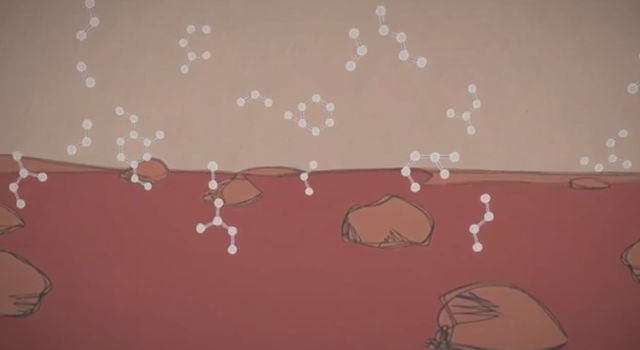
Mars in a Minute: Why is Curiosity Looking for Organics?
Has Mars ever had the right ingredients for life? What are organic molecules, and what can they tell us about the history of Mars? Learn more in this 60-second video.
Subject Science
Grades K-12
Time 1 min
Resources
Thanks to Roger Wiens and Jose Manrique for contributing to this lesson.