Problem Set
Lessons in Sea-Level Rise
This activity is related to a Teachable Moment from Sept. 3, 2015. See "The Science of Earth's Rising Seas."
Overview
What is sea-level rise and how does it affect us? This "Teachable Moment" looks at the science behind sea-level rise and offers lessons and tools for teaching students about this important climate topic.Materials
Management
The questions involved in this activity refer to interactive online graphs. For the most accurate results, be sure students have access to the Internet. However, if Internet access is not available for students, consider projecting one set of graphs for the whole class to consult and appointing one student to mouse over appropriate points. Alternately, print hard copies of the graphs for students to mark up and estimate using their graph-reading skills.
Because preconceived notions may influence perception of fact, be sure to have students do the math first, then attempt to draw science conclusions. This sequencing will provide them with independent data from which to make statements.
Background
In the News
“Sea level rise” – we hear that phrase, but what does it mean, really? How does it affect us? Do I have to be concerned about it in my lifetime? These are all great questions!
Sea level rise is the increasing of the average global sea level. It doesn’t mean that seas are higher by the same amount everywhere. In fact, in some areas, such as the west coast of the US, sea level has actually dropped slightly … for now. But before we get into that, let’s understand the main contributors to sea level rise:
- Melting mountain glaciers - Glaciers are bodies of ice on land that are constantly moving, carving paths through mountains and rock. As glaciers melt, the runoff flows into the oceans, raising their levels.
- Melting polar ice caps - Think of our north and south polar regions. At both locations, we have ice on land (“land ice”) and ice floating in the ocean (“sea ice”). Melting sea ice, much like ice cubes melting in a drink, does not affect the level of the oceans. Melting land ice, however, contributes to about one third of sea level rise.
- Thermal expansion of water - Consider that our oceans absorb over 90 percent of the heat trapped by greenhouse gasses in Earth’s atmosphere. When water heats up, its molecules become more energetic, causing the water to expand and take up more room, so that accounts for about a third of sea level rise.
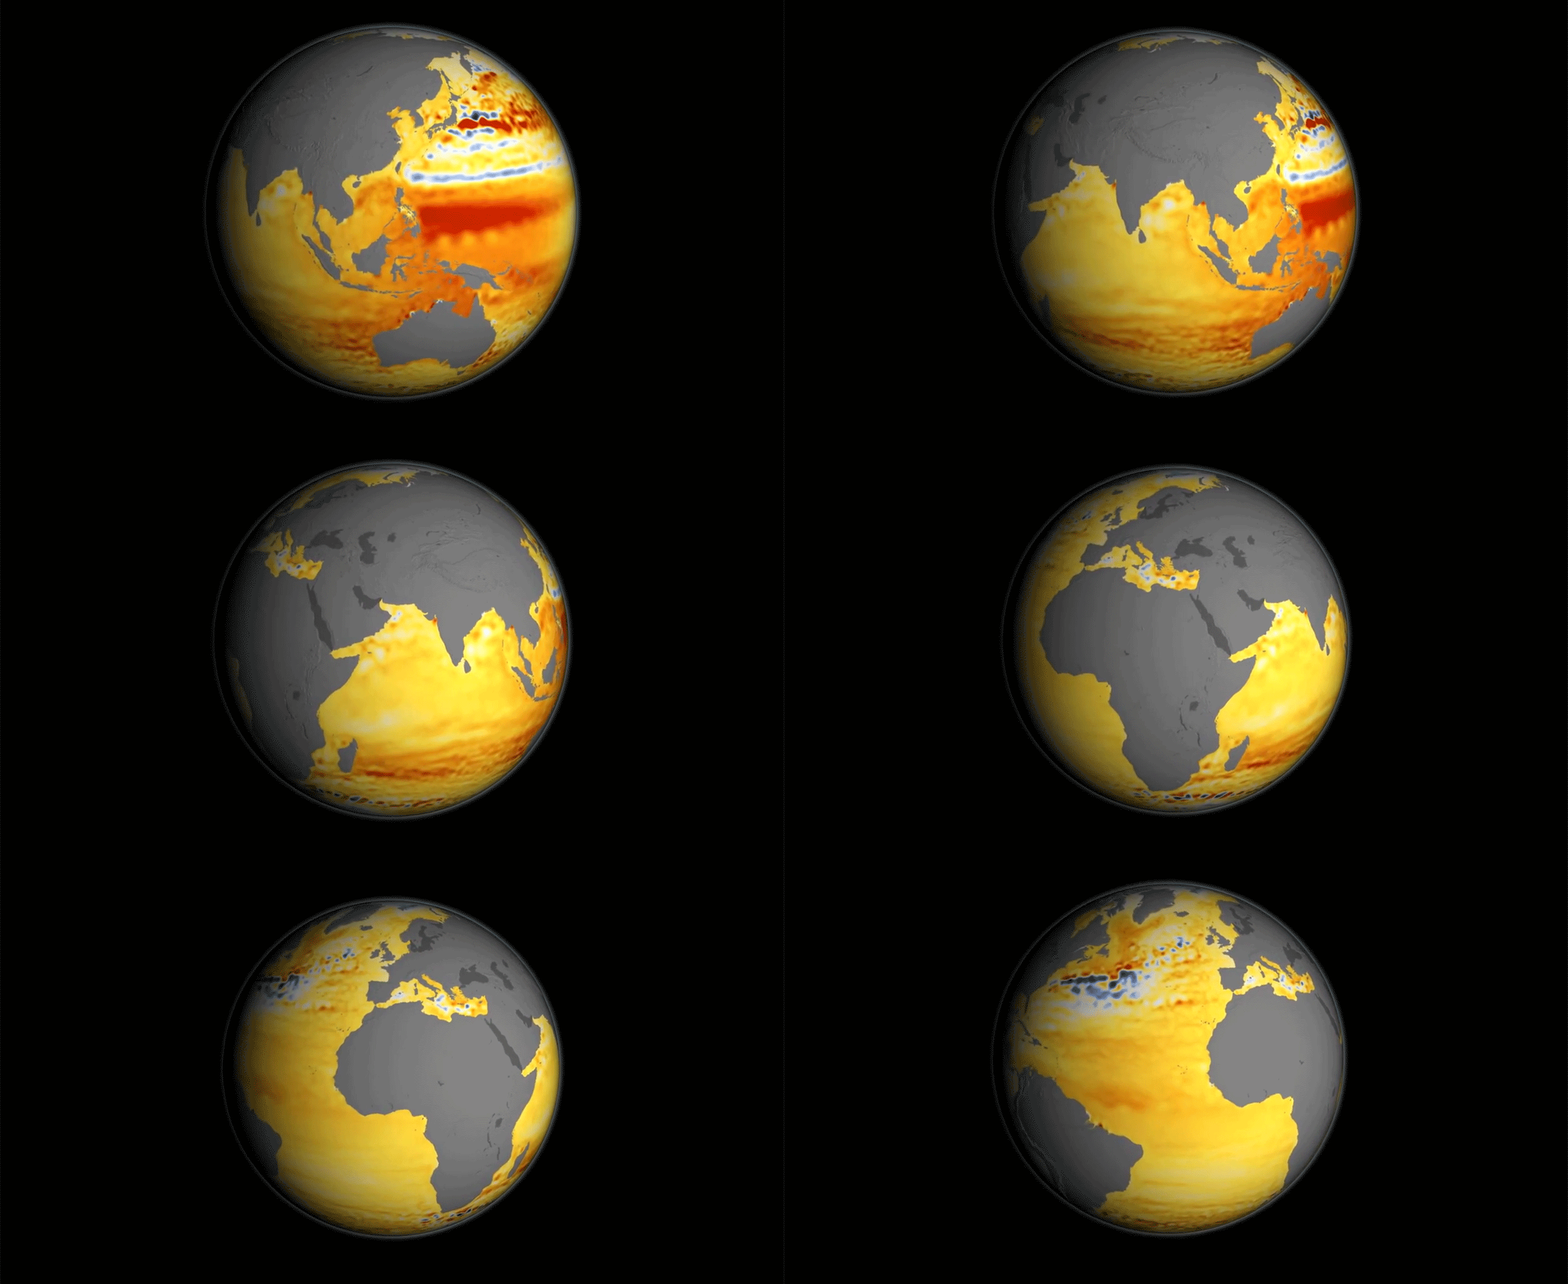
Let’s take a closer look at global sea levels. Sea level is not constant everywhere. This is because it can be affected by ocean currents and natural cycles, such as the Pacific Decadal Oscillation, or PDO, a 20- to 30-year cyclical fluctuation in the Pacific Ocean’s surface temperature. Because of the PDO, right now the Eastern Pacific has higher sea levels than usual, while the Western Pacific has lower sea levels than usual. However, the global average of 3.4 millimeters of sea level rise per year is increasing and the rate that it’s increasing is speeding up. That means that sea level is rising, and it’s rising faster and faster. Take a look at this video for some great visuals and further explanation of how phenomena such as the Gulf Stream affect local sea level heights.
You may be asking yourself, how do we know sea levels are rising? Well, a couple of ways. First, since 1993 we have been using data from several NASA satellites to constantly measure sea surface height around the globe. Data from these ocean altimeters is integrated to refine and calibrate measurements. Additionally, we have tide gauges on Earth to ground-truth (locally validate) our satellite measurements. As for historical data, we use sediment cores -- drillings into Earth that yield the oldest layers on the bottom and the youngest layers on top -- to examine where oceans once reached thousands of years ago.
Why it's important
Locally, folks are making observations – and already seeing the impacts of sea level rise on their communities. Places such as Miami are now experiencing regular flooding in downtown city streets at high tide. The South Pacific island nation of Kiribati saw a 2.6 millimeter rise in sea level between 1992 and 2010. That may not seem like much, but when you consider that the land only sits about 2 meters above sea level, that’s a big deal; some villages have already had to relocate to escape the rising tides. Residents of China's Yellow River delta are swamped by sea level rise of more than 25 centimeters (9 inches) a year. Even NASA is concerned about some of its facilities that are located in low-lying areas.
Besides wiping out dry land, encroaching salt water can pollute our fresh water supplies and damage fresh-water dependent ecosystems. It’s not just fresh water rivers and lakes that are at risk – our aquifers, or natural underground water storage, are at risk of filling with salt water as the ocean encroaches on the land above them.
Clearly, sea level rise is something that is already affecting people and will continue to do so. All three contributors to sea level rise can be attributed to the warming of the Earth system. Warming temperatures cause mountain glaciers and polar ice caps to melt, thereby increasing the volume of water in the oceans. At the same time, our oceans are getting warmer and expanding in volume as a result of this heat (thermal expansion). Since 1880, global sea level has risen 23 centimeters (9 inches); by 2100, it is projected to rise another 30 to 122 centimeters (1 to 4 feet). Watch this video for some illustrations of these facts:
Also check out the Climate Time Machine for Sea Level to see what impact a 1 meter to 6 meter rise in sea level will have on the coastal US and other areas of the world.
If we can control our contributions to the rise in greenhouse gases in Earth’s atmosphere, we can perhaps level out the warming of the Earth system and eventually stabilize our sea levels. In the meantime, we need to be prepared for the impact encroaching seas will have on our coastal communities and water supplies.
Use it in the classroom
To engage your students in analyzing real climate data and drawing their own conclusions, have them try the Next Generation Science Standards and Common Core Mathematics aligned problems below.
Procedures
Teacher Procedure
- Have students first examine the satellite data graphs referenced below (and on the Student Worksheet) and answer the associated questions (according to ability).
- Discuss what they have learned from the data, and show associated supporting videos from the "Background" section of this activity as the discussion evolves.
- Lead students through the problem-solving activity identified in the "Discussion" section of this activity.
Student Procedure
Have students use these two satellite data graphs to answer the questions below. (To obtain exact data points, place your mouse on the section of the graph you would like to examine.)
- What is the source of the data for each graph?
- Which years are covered by each graph?
- Is one graph a better representation of global sea levels than the other? Why or why not?
- By approximately how many millimeters did sea level rise between:
A) 1910 and 1930?
10 mm (approx.)
B) 1930 and 1950?65 mm (approx.)
- What is the approximate average rate of increase of sea level rise between 1900 and 2000?
Note: students of various math abilities may approach and solve this problem within their capabilities. The most sophisticated approach is to find the slope of the line of best fit. The correct answer is approximately 1.4 mm per year.
- By how many millimeters did sea level rise between the first measurement obtained in January 1993 and the first measurement obtained in January 2021?
96.7 mm
- What is the approximate rate of sea level rise between January 1993 and present?
Note: The answer for this problem is directly stated at the top of the graph. Students of various math abilities may approach and solve this problem within their capabilities. The most sophisticated approach is to find slope of the line of best fit.
- By how much did the average global temperature change, and did it increase or decrease between 1910 and 1930? How about between 1930 and 1950?
Students should determine whether each span of years shows an increase or decrease in temperature and calculate how much of an increase or decrease was measured.
- Compare your answers to question number 8 with your answers to question number 4. Can you offer an explanation for the correlation or lack thereof?
Encourage students to critically examine the graph, noting the temperature increase that occurred between 1930 and 1944, preceding the temperature decrease between 1944 and 1950. Students familiar with heat capacity should include this concept in their discussion.
- What is the approximate average global temperature rise per year from the first measurement taken in 1880 to present?
Note: students of various math abilities may approach and solve this problem within their capabilities. The most sophisticated approach is to find slope of the line of best fit. The most conservative answer is 0.007°C per year, the best-fit answer is closer to 0.01°C.
Have students examine this line graph for average global temperature and use it to answer the questions below. If using the data table linked below the graph, students should use the "No_Smoothing" data points rather than the "Lowess (5)" data points.
Discussion
Watch the video below to learn more about our changing climate, then discuss what could be done to control greenhouse gases in our atmosphere. Check out this interactive feature to see what others around the globe are doing and add your ideas.
Assessment
Assess student ability to perform mathematical operations separately from their ability to draw science conclusions from the data. Because preconceived notions may influence perception of fact, be sure to have students do the math first, then attempt to draw science conclusions. This sequencing will provide them with independent data from which to make statements and give them a better chance of drawing conclusions from the data rather than making statements based on preconceived notions.Extensions
Activity
Videos
Images and Graphics
Interactives
News and Resources
- Earth Right Now Blog
- NASA Sea Level Change Portal
- Article: "Warming Seas and Melting Ice Sheets"
- Article: "The Fingerprints of Sea Level Rise"
- NASA's Climate Change website
- NASA Earth Missions
- Teachable Moments Blog


