


Classroom Activity
Modeling the Water Budget

Overview
In this activity, students will use California precipitation totals and evapotranspiration data to calculate and graph water deficits and surpluses. These spreadsheet models will help students understand droughts and the movement of water in the water cycle.
Materials
Management
- This lesson can be done individually or in groups of two to three students.
- On the spreadsheet, rename the ETo cell “evapotranspiration” for ease of understanding.
- Depending on students’ abilities, format all data cells as numbers and adjust the number of decimals displayed (zero, one, or two decimals).
- Tailor the amount of spreadsheet formatting and layout input that you provide based on students’ comfort level with spreadsheet software.
- Adjust the amount of data provided versus the amount of data students must find on their own based on students’ ability to research.
- This activity uses only two components of a water budget: precipitation and evapotranspiration. Water inflow, water outflow, and changes in water storage are not considered.
Background
The water cycle describes the processes by which water moves between different parts of a water budget – processes like rainfall, water flow, and evaporation. A water budget is an account of the water stored in a system, such as a watershed, and the movement of water in and out of that system. The equation used to calculate a water budget broadly includes precipitation, water flow into a system, water flow out of a system, changes in water storage, and evapotranspiration. This lesson explores two components, precipitation and evapotranspiration, to highlight their impacts on a region's water budget.
Here's why understanding Earth’s "water budget" is an important part of understanding our planet and planning for future water needs.
Evapotranspiration is an important part of the water cycle. It is the combination of evaporation (the direct loss of surface water to the atmosphere) and transpiration (the loss of water to the atmosphere as water vapor from plants). It could account for nearly half of the moisture loss in soil. Evapotranspiration is influenced by solar radiation, temperature, relative humidity, wind, soil moisture, and the density and type of vegetation in an area.
This animation shows the process of evapotranspiration.
Due to the variety of climates, surface types, and vegetation coverage across the state of California, it’s currently not possible to know the exact amount of water being lost to the atmosphere through evapotranspiration at a given time.
However, using climate data and hypothetical surface types for various regions, scientists have created a reference rate known as “potential evapotranspiration” for 18 different zones in the state. These reference rates approximate the amount of water that could be lost through evapotranspiration during each month of the year for each zone.
Comparing potential evapotranspiration to actual rainfall data (precipitation) can provide a window into part of the water budget for a particular area. During months when more rain falls than potentially evapotranspirates, there will be a water surplus between those budget components. During months when less rain falls than potentially evapotranspirates, there will be a water deficit. Calculating these data is an important part of studying climate and droughts.
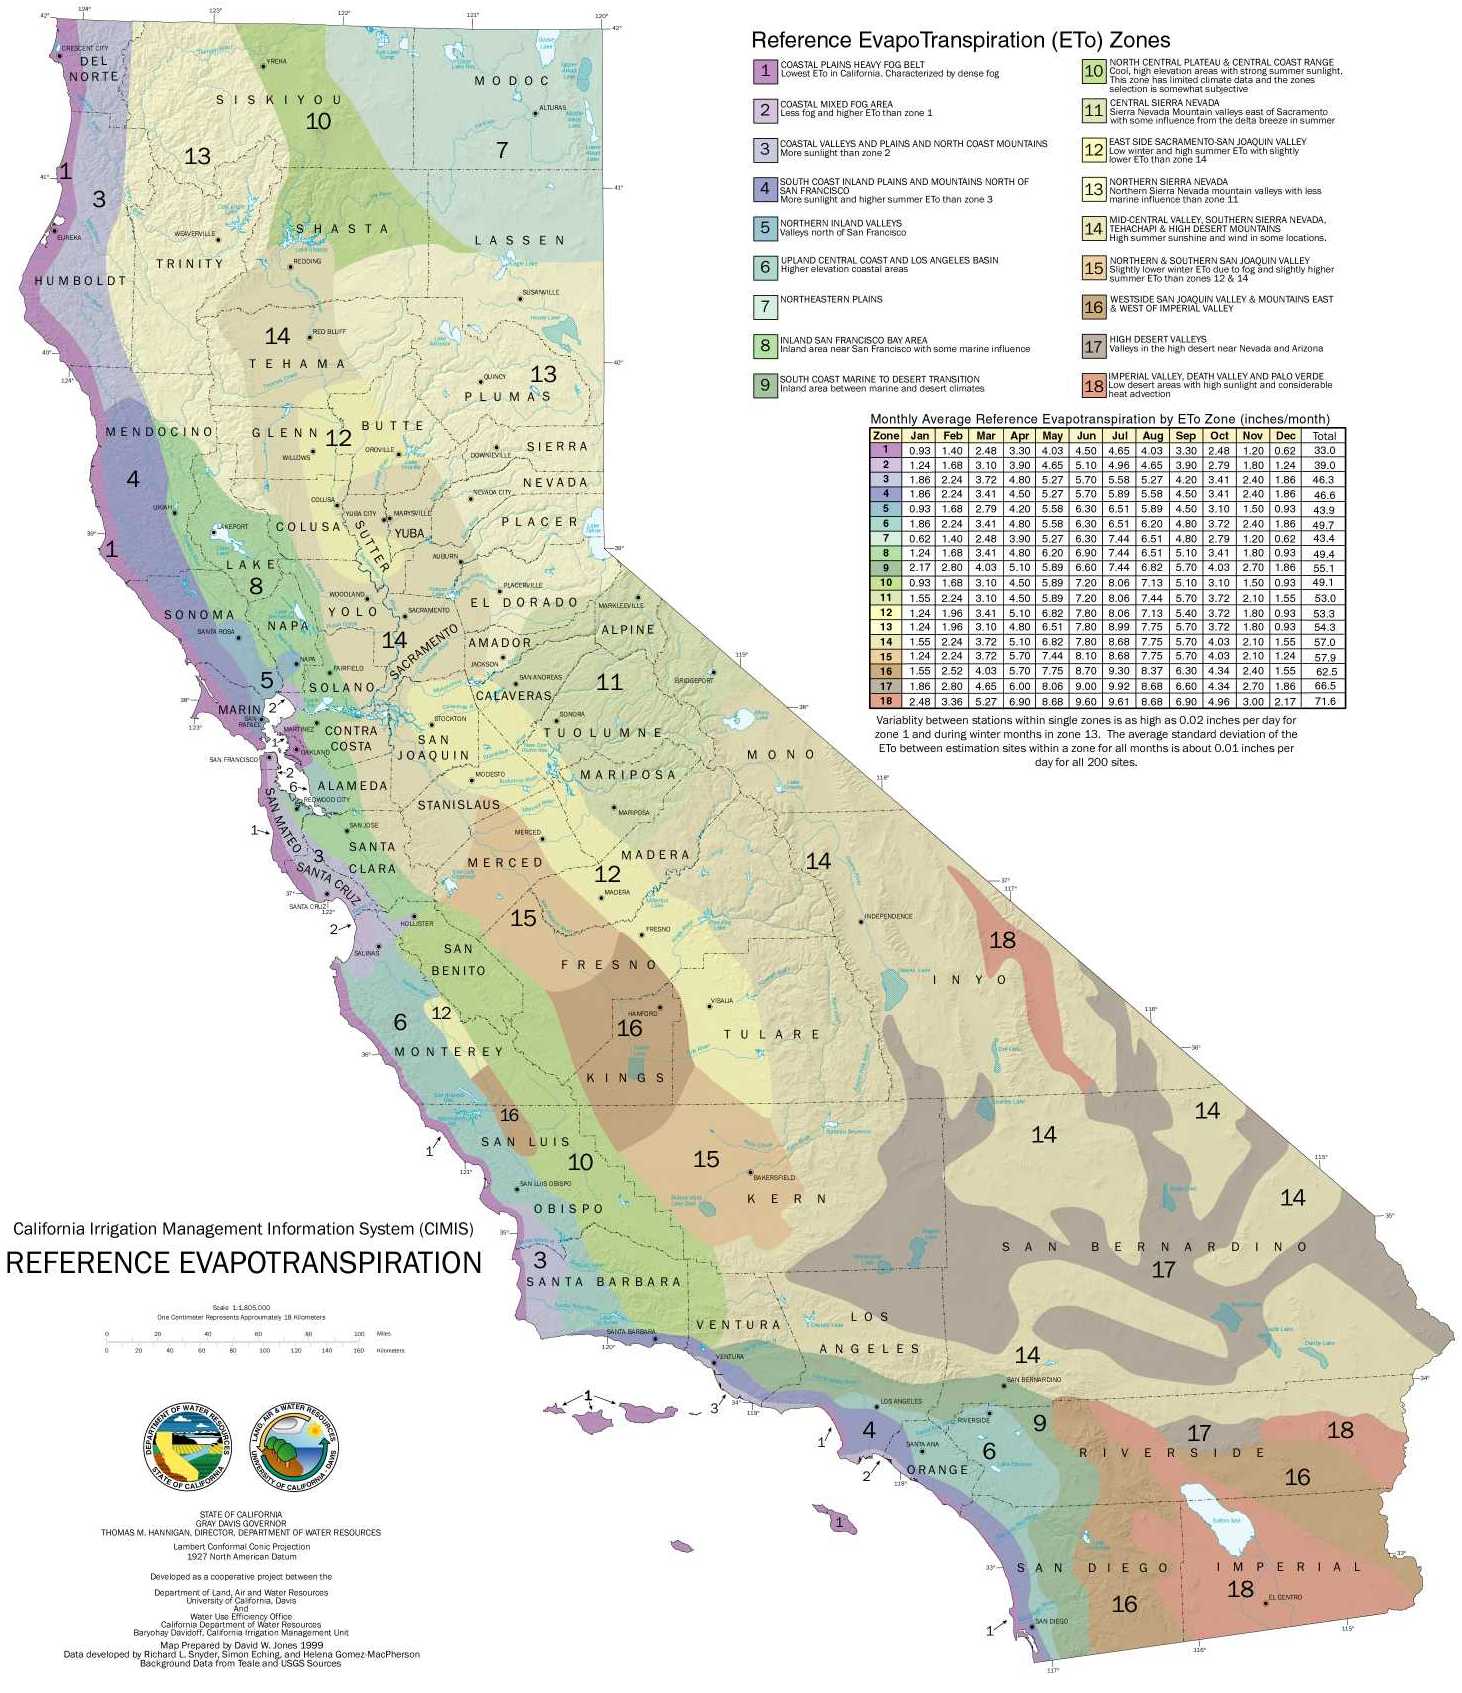
Map of evapotranspiration zones in California. | + Expand image
Vocabulary
- Transpiration – The process in which water is lost to the atmosphere as water vapor through a plant’s leaves.
- Evaporation – The process in which water is lost to the atmosphere as water vapor from the ground and exposed water.
- Evapotranspiration – A combination of evaporation from open water and ground sources, and the transpiration of water from plants to the atmosphere.
- Potential Evapotranspiration – The amount of water that could be lost through evapotranspiration if there were an adequate supply.
- Precipitation – The process in which water vapor condenses in the atmosphere to form water droplets that fall to the Earth as rain, sleet, snow, hail, etc.
- Rain Year – The range of time used to measure rainfall totals in California, running from October 1 of the previous year to September 30 (i.e., Rain Year 2014 ended September 30, 2014).
Procedures
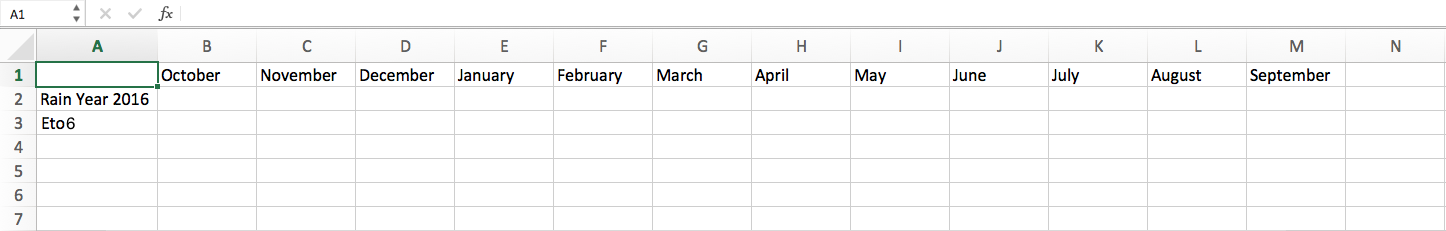
- Create a new blank spreadsheet.
- In column A, skip row 1. In row 2, enter “Rain Year 20xx.” (Replace xx with the two digits of the rain year, such as "2022".)
- In column A, row 3, enter “ETo xx”. (ETo is shorthand for Potential Evapotranspiration and xx represents the zone number, such as "ETo 4".)
- In row 1, use columns B-M to enter the months of the year. You may enter October-September to match the rain year, or January-December to match the calendar year. (You’ll want to rename your “Rain Year 20xx" cell to “20xx” if you use January-December).
- Identify which zone your school is in by using the California evapotranspiration zones map. If your school is outside the state students can select a location of their choice within California. They may need to explore other maps to determine which station measurement to use in Step 9.
- Find your zone on the California evapotranspiration zones table. Each row shows the number of inches of potential evapotranspiration per month.
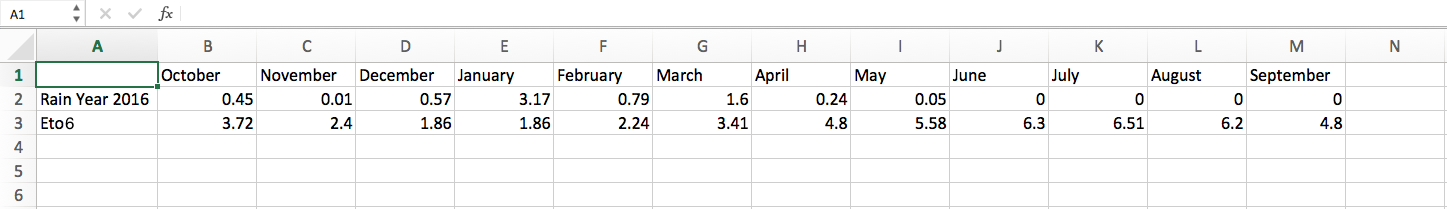
- Using data from the table, enter the monthly potential evapotranspiration amounts for your zone in row 3. Be sure to match the months carefully as the table data starts in January, but your first cell may be October.
- Using the California Department of Water Resources monthly precipitation reports, load the most recent complete rain year report by selecting September from the Archived Report Productsmenu. Depending on when you do this activity, you may have to navigate back one year to select September. PRECIPOUT reports list monthly rainfall totals from October 1 to September 30.
- Locate the station nearest your school and enter the monthly precipitation totals (in inches) in row 2. Again, be sure to carefully match the months in the spreadsheet. If you chose to enter the months in calendar order rather than rain-year order, do not rearrange the months. You will need to get data from two consecutive precipitation reports to get 12 consecutive calendar months (e.g., January-September of Rain Year 2015 and October-December of Rain Year 2016).
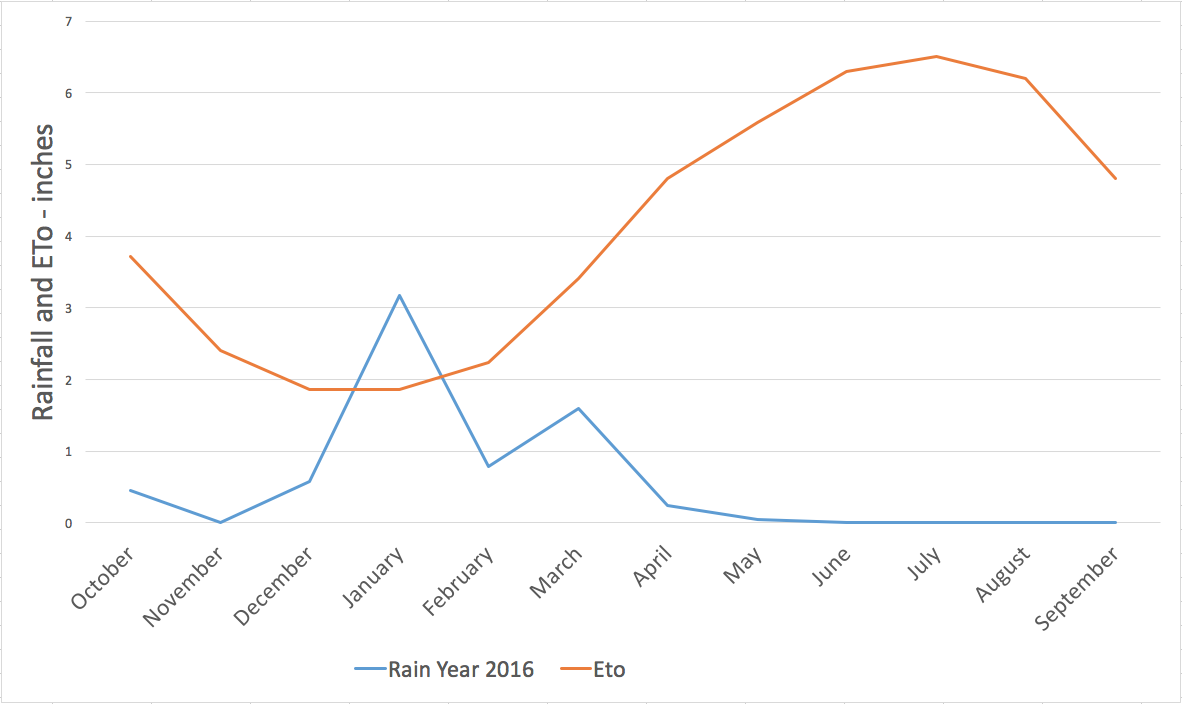
- Click and drag from cell A1 to M3 to select all cells containing data. Create a line chart. Depending on which software application students are using, there are multiple ways to do this. Add labels as necessary and format as desired.
Discussion
- What could cause the evapotranspiration curve to reach its low in January and its high in July?
- What would the chart look like if one inch of rain were added to each month? Why? How would it change if one inch of rain were added to January? August?
- How does knowing the annual and monthly water budgets of an area help guide decision making about city watering cycles, flood preparation and crop irrigation?
- What are some things not accounted for in these calculations that could increase or decrease the amount of available water in an area?
Assessment
- What is the total rainfall for the rain year selected?
- What is the total potential evapotranspiration possible in one year for the zone selected?
- What is the difference between the rainfall totals and the total potential evapotranspiration?
- Was there a water surplus or water deficit for the entire rain year, and how much?
- In which months if any was there a surplus of water? How much of a surplus was there in each of those months? What was the combined surplus of water for those months?
- In which months if any was there a deficit of water? How much of a deficit was there in each of those months? What was the combined deficit of water for those months?
Extensions
- Insert a row above the ETo row and add data for another rain year. Older data can be found on the California Department of Water Resources monthly precipitation archive. Students can choose from non-drought years or the year of their birth. Compare monthly and yearly totals.
- Use spreadsheet formulas to calculate totals, surpluses and deficits.
- Visit the USGS California Drought Visualization page. Discuss whether the reservoir levels rise and fall at expected times based on when there are increases or decreases in rainfall. Why do you think the reservoir levels rise and fall when they do?