


Teachable Moments | October 24, 2022
X-Ray Vision and Polarized Glasses Unite to Uncover Mysteries of the Universe

A NASA space telescope mission is giving astronomers a whole new way to peer into the universe, allowing us to uncover long-standing mysteries surrounding objects such as black holes. Find out how it works and how to engage students in the science behind the mission.
Some of the wildest, most exciting features of our universe – from black holes to neutron stars – remain mysteries to us. What we do know is that because of their extreme environments, some of these emit highly energetic X-ray light, which we can detect despite the vast distances between us and the source.
Now, a NASA space telescope mission is using new techniques to not only scout out these distant phenomena, but also provide new information about their origins. Read on to learn how scientists are getting exciting new perspectives on our universe and what the future of X-ray astronomy holds.
How They Did It
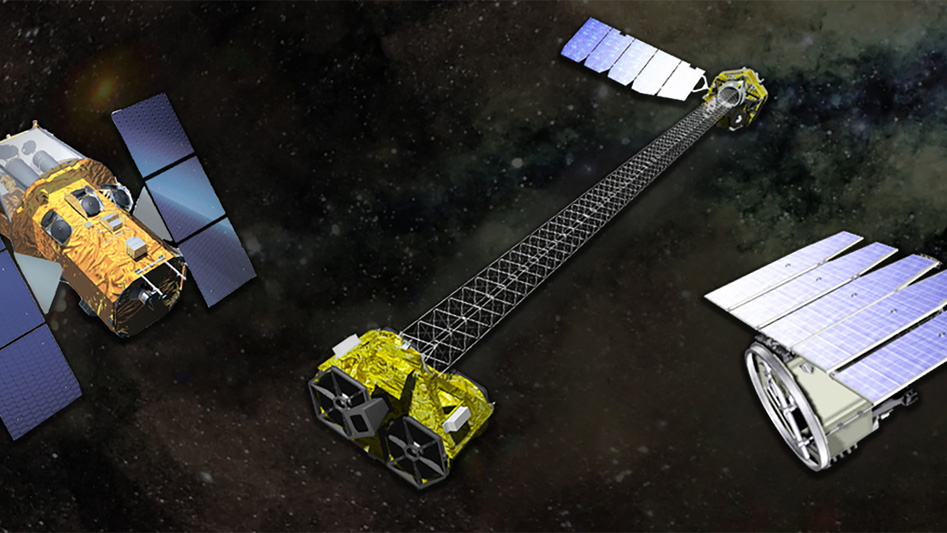
In 2021, NASA launched the Imaging X-Ray Polarimeter Explorer, or IXPE, through a collaboration with Ball Aerospace and the Italian Space Agency. The space telescope is designed to operate for two years, detecting X-rays emitted from highly energetic objects in space, such as black holes, different types of neutron stars (e.g., pulsars and magnetars) and active galactic nuclei. In its first year, the telescope is focusing on roughly a dozen previously studied X-ray sources, spending hours or even days observing each target to reveal new data made possible by spacecraft's scientific instruments.
IXPE isn't the first telescope to observe the universe in X-ray light. NASA's Chandra X-ray Observatory, launched in 1999, has famously spent more than 20 years photographing our universe at a wavelength of light exclusively found in high-energy environments, such as where cosmic materials are heated to millions of degrees as a result of intense magnetic fields or extreme gravity.
Using Chandra, scientists can assign colors to the different energy levels, or wavelengths, produced by these environments. This allows us to get a picture of the highly energetic light ejected by black holes and tiny neutron stars – small, but extremely dense stars with masses 10-25 times that of our Sun. These beautiful images, such as from Chandra’s first target, Cassiopeia A (Cas A for short), show the violent beauty of stars exploding.
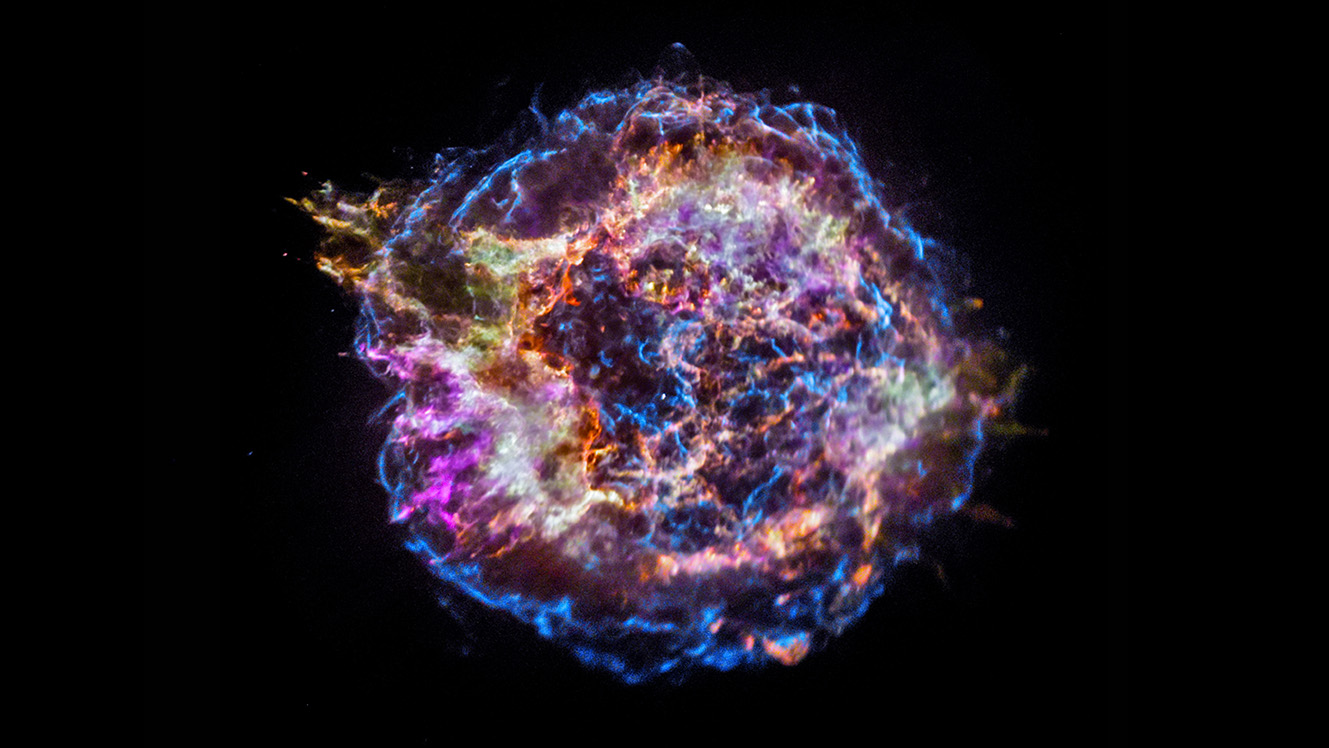
This image of the supernova Cassiopeia A from NASA’s Chandra X-ray Observatory shows the location of different elements in the remains of the explosion: silicon (red), sulfur (yellow), calcium (green) and iron (purple). Each of these elements produces X-rays within narrow energy ranges, allowing maps of their location to be created. Image credit: NASA/CXC/SAO | › Full image and caption
While Chandra has earned its name as one of “The Great Observatories,” astronomers have long desired to peer further into highly energetic environments in space by capturing them in even more detail.
IXPE expands upon Chandra’s work with the introduction of a tool called a polarimeter, an instrument used to understand the shape and direction of the light that reaches the space telescope's detectors. The polarimeter on IXPE allows scientists to gain insight into the finer details of black holes, supernovas, and magnetars, like which direction they are spinning and their three-dimensional shape.

This image of Cassiopeia A was created using some of the first X-ray data collected by IXPE, shown in magenta, combined with high-energy X-ray data from Chandra, in blue. Image credit: NASA/CXC/SAO/IXPE | › Full image and caption
While scientists have just begun putting IXPE's capabilities to use, they're already starting to reveal new details about the inner workings of these objects – such as the magnetic field environment around Cas A, shown in a newly released image.
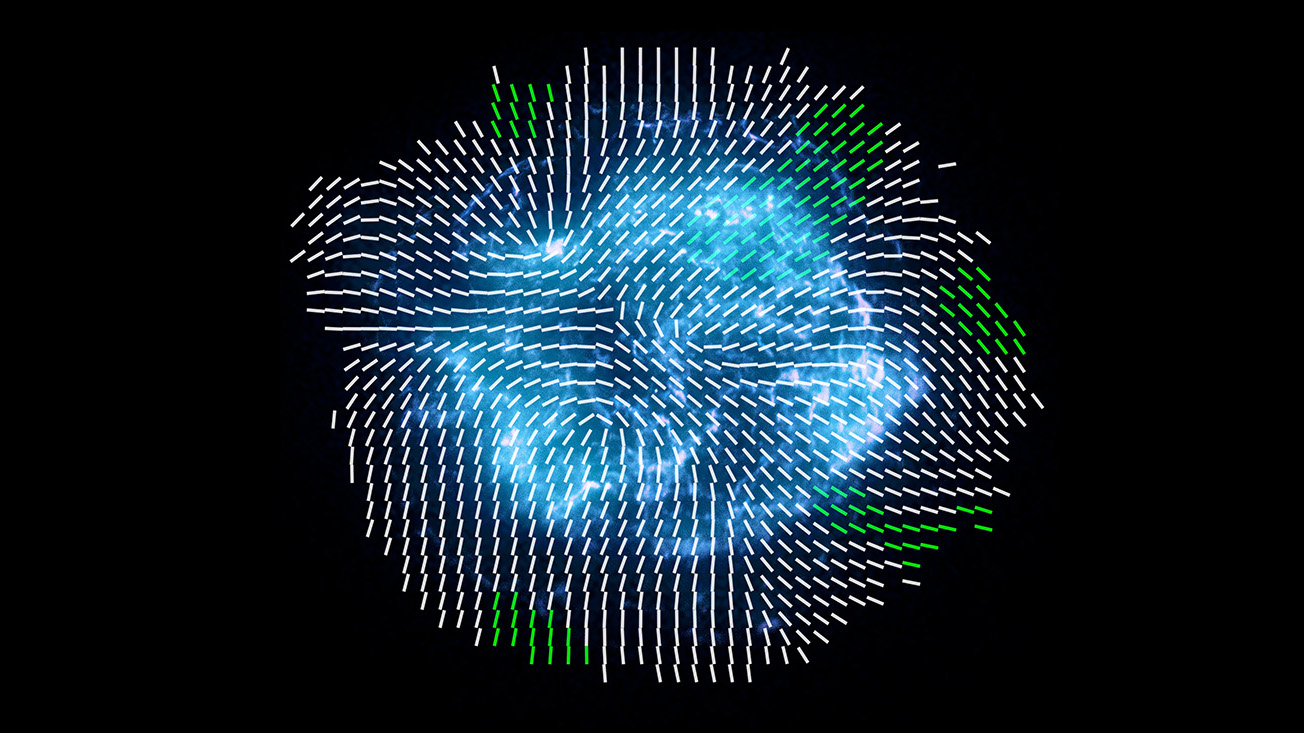
The lines in this newly released image come from IXPE measurements that show the direction of the magnetic field across regions of Cassiopeia A. Green lines indicate regions where the measurements are most highly significant. These results indicate that the magnetic field lines near the outskirts of the supernova remnant are largely oriented radially, i.e., in a direction from the center of the remnant outwards. The IXPE observations also reveal that the magnetic field over small regions is highly tangled, without a dominant preferred direction. Observations such as this one can help scientists learn how particles shooting out from supernovae interact with the magnetic field created by the explosion. Image credits: X-ray: Chandra: NASA/CXC/SAO; IXPE: NASA/MSFC/J. Vink et al. | + Expand image | › Full image and caption
“For the first time, we will use every collected photon of light to tell us about the nature and shapes of objects in the sky that would be dots of light otherwise,” says Roger Romani, a Stanford professor and the co-investigator on IXPE.
How It Works
Generally, when light is produced, it is what we call unpolarized, meaning that it oscillates in every direction. For example, our Sun produces unpolarized light. But sometimes, light is produced in a highly organized fashion, oscillating only in one direction. In astronomy, this arises when magnetic fields force particles to incredibly high speeds, creating highly organized, or polarized, light.
This is what makes objects like the supernova Cas A such enticing targets for IXPE. Exploded stars like Cas A generate massive energetic waves when they go supernova, giving scientists a view of how particles shooting out at immense speeds interact with the magnetic fields from such an event. In the case of Cas A, IXPE was able to determine that the x-rays are not very polarized, meaning the explosion created very turbulent regions with multiple field directions.
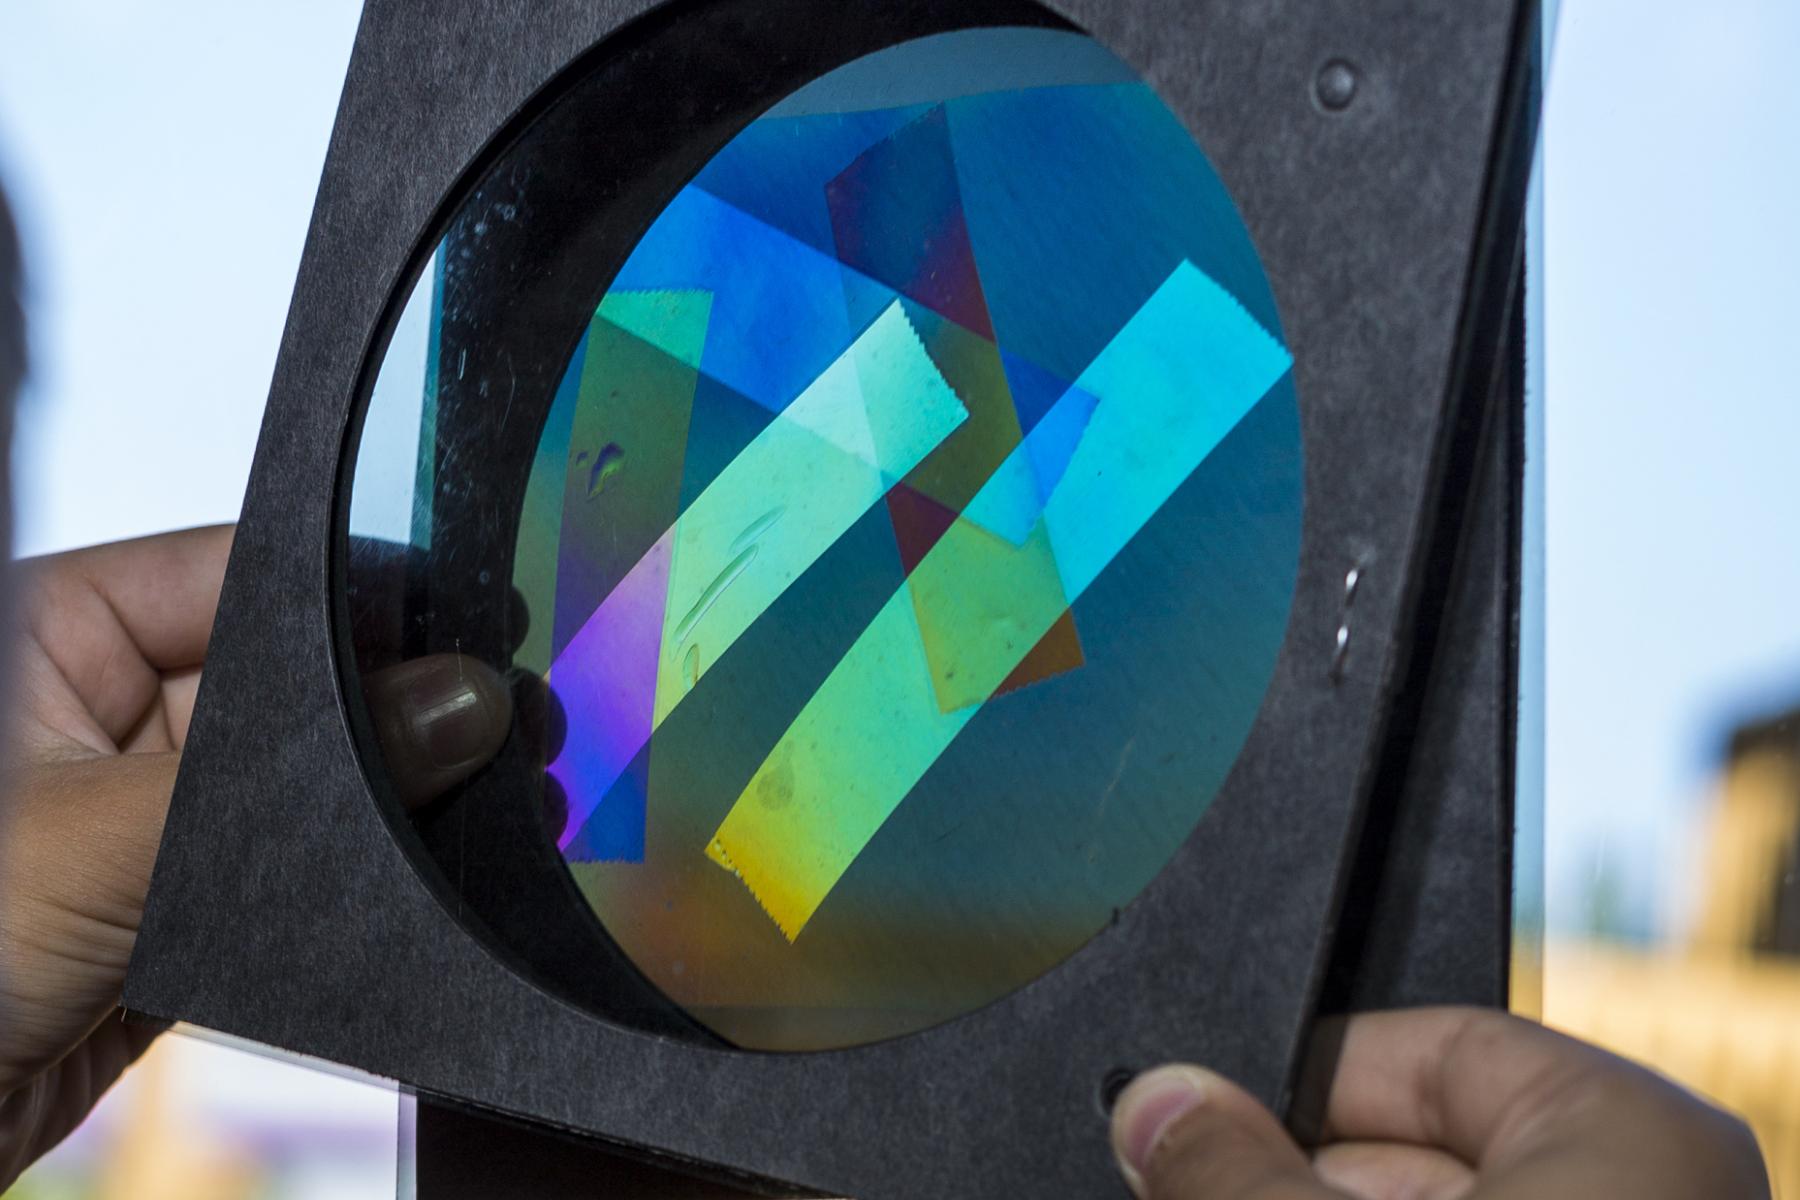
While the idea of polarized or organized light may sound abstract, you may have noticed it the last time you were outside on a sunny day. If you’ve tried on a pair of polarized sunglasses, you may have noticed that the glare was greatly reduced. That’s because as light scatters, it bounces off of reflective surfaces in all directions. However, polarized lenses have tiny filters that only allow light coming from a narrow band of directions to pass through.
The polarimeter on IXPE works in a similar way. Astronomers can determine the strength of an object's magnetic field by using the polarimeter to measure how much of the light detected by the telescope is polarized. Typically, the more polarized the light the stronger the magnetic field at the source.
Astronomers can even go a step further to measure the direction this light is oscillating by measuring the angle of the light that reaches the telescope. Because the polarized light leaves the source in a predictable fashion – namely perpendicular from its magnetic field – knowing the angle of the oscillating light provides information about the axis of rotation and potentially even the surface structure of objects such as neutron stars and nebulae.

In this demonstration, the rope represents light waves and the open window represents a polarimeter. Depending on the angle of the light waves (rope), more or less information makes it through the polarimeter (window) the narrower it is. By measuring the amount of light received through the polarimeter, IXPE can determine the angle and the polarization of the light. Image credit: NASA/JPL-Caltech | + Expand image
Imagine, for example, that you were holding one end of a piece of rope secured to an object at the other end. If you swung the rope side to side to make horizontal waves, those waves would be able to make it through a narrow target like a window. If you started to shut the window from the top, narrowing the opening, the waves could conceivably still make it through the opening. However, if you made veritcal waves by waving the rope up and down, as the window closed, fewer and fewer waves would make it through the opening. Likewise, by measuring the light that makes it through the polarimeter to the detector on the other side, IXPE can determine the angle of the light received.
To collect this light, IXPE uses three identical mirrors at the end of a four meter (13 foot) boom. The light received by IXPE is carefully focused on the spacecraft’s polarimeter at the other end of the boom, allowing scientists to collect those crucial measurements.
During the IXPE launch broadcast, commentators discuss the components of the spacecraft and how it measures polarization. | Watch on YouTube
Why It's Important
Building on Chandra's observations from the past two decades, IXPE's novel approach to X-ray science is pulling the curtain back even farther on some of the most fascinating objects in the universe, providing first looks at how and where radiation is being produced in some of the most extreme environments in the universe. IXPE's measurements of Cas A are just the beginning, with even more mysterious targets ready to be explored.
Take it from Martin Weisskopf, the principal scientist on IXPE and project scientist for Chandra, who has spent his 50-year career working in X-ray astronomy, who says, “IXPE will open up the field in ways we’ve been stuck only theorizing about."
Teach It
Explore more on how NASA uses light to map our universe, and dig deeper into some of the celestial features it allows to study, such as blackholes and neutron stars.
Activities
-
 Project
Exploring Materials - Polarizers
In this activity, learners experiment how polarizers affect light by using two polarizing sheets and overlapping layers of transparent tape.
-
 Activity Guidebook
Girls STEAM Ahead with NASA Program Cookbook
A guidebook for facilitators planning their own Girls STEAM Ahead with NASA event using NASA’s Universe of Learning resources.
-
 Slideshow
Black Holes: By the Numbers
What are black holes and how do they form? Explore more in this slideshow.
-
 Video
VideoWhat Is a Black Hole?
Find out how what a black hole is, how they can form and why they are so cool!
Educator Resources
-
Science Briefing: Exploring the High Energy Universe
Explore the event materials from this science briefing to get a window into the most energetic processes and the most extreme objects in the universe.
Subject Science
-
The Science of Color
Quickly and easily model how colors reflect, absorb, and interact with each other in the classroom or online using your computer’s camera.
Subject Science
Grades 2-8
Time < 30 mins
-

Using Light to Study Planets
Students build a spectrometer using basic materials as a model for how NASA uses spectroscopy to determine the nature of elements found on Earth and other planets.
Subject Science
Grades 6-11
Time 2+ hrs
-

Dropping In With Gravitational Waves
Students develop a model to represent the collision of two black holes, the gravitational waves that result and the waves' propagation through spacetime.
Subject Science
Grades 6-8
Time 30-60 mins
-
 Teachable Moments
Telescopes Get Extraordinary View of Milky Way's Black Hole
Find out how scientists captured the first image of Sagittarius A*, why it's important, and how to turn it into a learning opportunity for students.
-
 Teachable Moments
How Scientists Captured the First Image of a Black Hole
Find out how scientists created a virtual telescope as large as Earth itself to capture the first image of a black hole's silhouette.
-
 Teachable Moments
Gravitational Waves Detected for the First Time
Find out how researchers proved part of Albert Einstein’s Theory of General Relativity, then create a model of the Nobel Prize-winning experiment in the classroom.
Explore More
- Article: NASA’S IXPE Helps Unlock the Secrets of Famous Exploded Star
- Educator Guide: Black Hole Math
- Opportunity: NASA/IPAC TeacherArchive Research Program
- Student Resources: Chandra
- Article: Hubble - Black Holes
- Interactive: Sagittarius A*
- Video: Hubble - Black Holes
- Website: NASA Science - Black Holes
- Download: A Galaxy Full of Black Holes Presentation
- Expert Talk: Imaging a Black Hole Lecture
- Facts & Figures: NASA - Black Holes
- Article: Black Hole Image Makes History
- Infographic: Anatomy of a Black Hole
NASA's Universe of Learning materials are based upon work supported by NASA under award number NNX16AC65A to the Space Telescope Science Institute, working in partnership with Caltech/IPAC, Center for Astrophysics | Harvard & Smithsonian, and the Jet Propulsion Laboratory.
TAGS: Universe, Stars and Galaxies, Space Telescope, IXPE, Astronomy, Science, Electromagnetic Spectrum, Universe of Learning


Teachable Moments | August 9, 2022
Webb Telescope Sees the Universe Like We've Never Seen It Before

Here's what we learned from the first set of images captured by NASA's newest space observatory and how to translate it into learning opportunities for students.
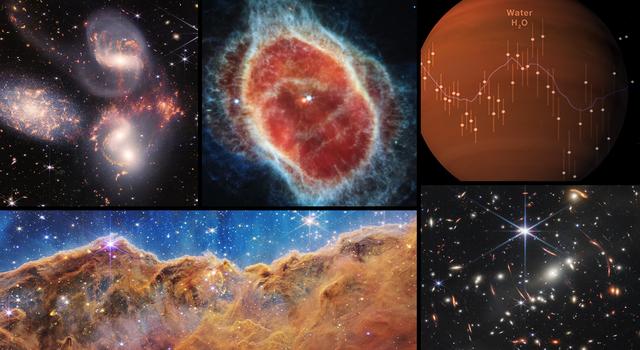
NASA’s newest space observatory, the James Webb Space Telescope, has returned its first set of images and spectra of five different targets – from nebulae to exoplanets to galaxy clusters – revealing the universe in ways never before seen. These targets, selected by a team of experts, represent just the start of the telescope's science operations and the beginning of our ability to see the universe in a whole new way.
Read on to learn more about what the space-based observatory’s images can tell us about the cosmos, how they were captured, and how to engage learners in the science and engineering behind the mission.
What JWST Saw
New Details Revealed About the Birth of Stars
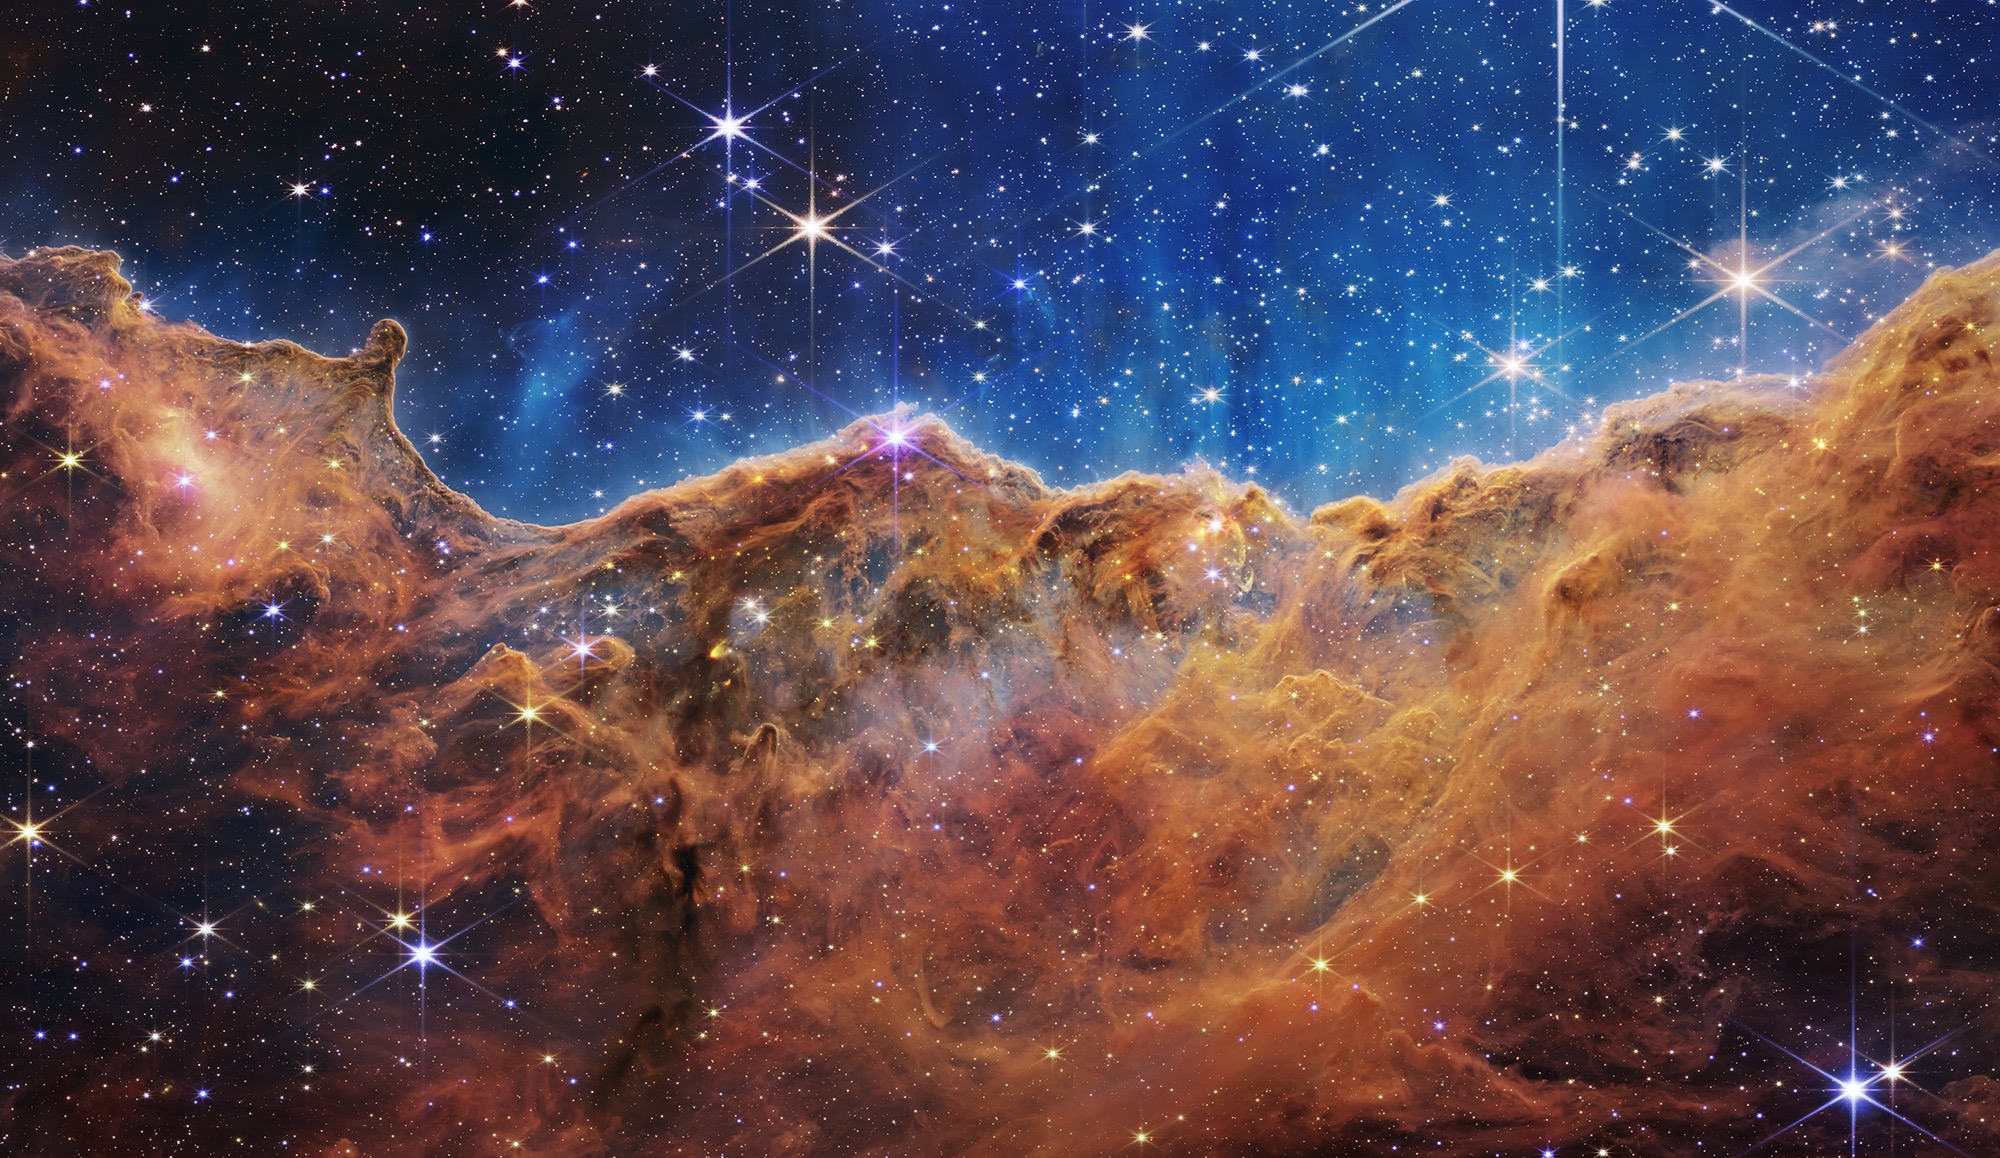
What looks much like craggy mountains on a moonlit evening is actually the edge of a nearby, young, star-forming region NGC 3324 in the Carina Nebula. Captured in infrared light by the Near-Infrared Camera (NIRCam) on NASA’s James Webb Space Telescope, this image reveals previously obscured areas of star birth. Credit: NASA, ESA, CSA, STScI | › Full image and caption | › Text description (PDF)
Stellar nurseries, young stars, and protostellar jets, which are narrow, ultra-fast streams of gas emanating from baby stars, are all on display in this image of the Carina Nebula, a cloud of gas and dust approximately 7,600 light years away.
Nebulae are massive clouds of gas and dust, some spanning up to hundreds of light-years across. Thanks to its infrared cameras, JWST can peer into these dusty regions of space, revealing incredible details previously unseen by other telescopes.
Within the Carina Nebula, a star-forming region known as NGC 3324 was captured by the Webb telescope in this image. As the edge of this region moves inward toward the gas and dust, it may encounter unstable areas. The pressure changes can cause the gas and dust to collapse, forming a new star in a process called accretion. However, if too much material is pushed away, it may prevent a star from forming.
The Webb telescope’s observations in nebulae like this will help scientists answer some of the unknown questions of astrophysics, like what determines the number of stars in a certain region and why do stars form with certain masses.
Scientists can also learn how star formation affects these clouds. Little is known about the numerous small, or low-mass, stars within nebulae. But by studying the jets revealed in the new image, scientists can understand how these stars are expelling gas and dust out of the cloud, thereby reducing the amount of material available to form new stars. Furthermore, scientists will be able to get a full count of these low-mass stars and account for their impact throughout the nebula.
Signs of Water on a Distant Planet

A transmission spectrum made from a single observation using Webb’s Near-Infrared Imager and Slitless Spectrograph (NIRISS) reveals atmospheric characteristics of the hot gas giant exoplanet WASP-96 b. Credits: NASA, ESA, CSA, STScI | › Full image and caption | › Text description (PDF)
JWST's observations of exoplanet WASP-96 b, a planet outside our solar system, is not an image but a spectrum of light. Within the spectrum are highlights that indicate the presence of water molecules. The spectrum also shows evidence of clouds and haze, which were thought not to exist in WASP-96 b's atmosphere.
WASP-96 b is an exoplanet made up mostly of gas. About half the mass of Jupiter, but slightly larger, it orbits much closer to its star, completing a revolution every 3.4 days compared with 12 years for Jupiter.
This measurement, known as a transmission spectrum, was collected as WASP-96 b transited, or passed in front of, its host star from the perspective of the telescope. It compares the light that passed through the atmosphere of the exoplanet with the light from the planet's parent star alone. As a result, it is possible to see the amount of light at each wavelength blocked by the planet and absorbed by its atmosphere, telling scientists the size of the planet and the chemicals contained in its atmosphere.
While WASP-96 b’s spectrum had been captured before, the Webb telescope provided the most detailed view of its spectrum in near-infrared, and the improved resolution completely changed our understanding of the exoplanet’s atmosphere. Using this spectrum, scientists will be able to measure the amount of water in the exoplanet's atmosphere, determine how much oxygen and carbon it contains, infer the make-up of the planet, and even how, when, and where it formed.
Star Pair Coming Into Focus
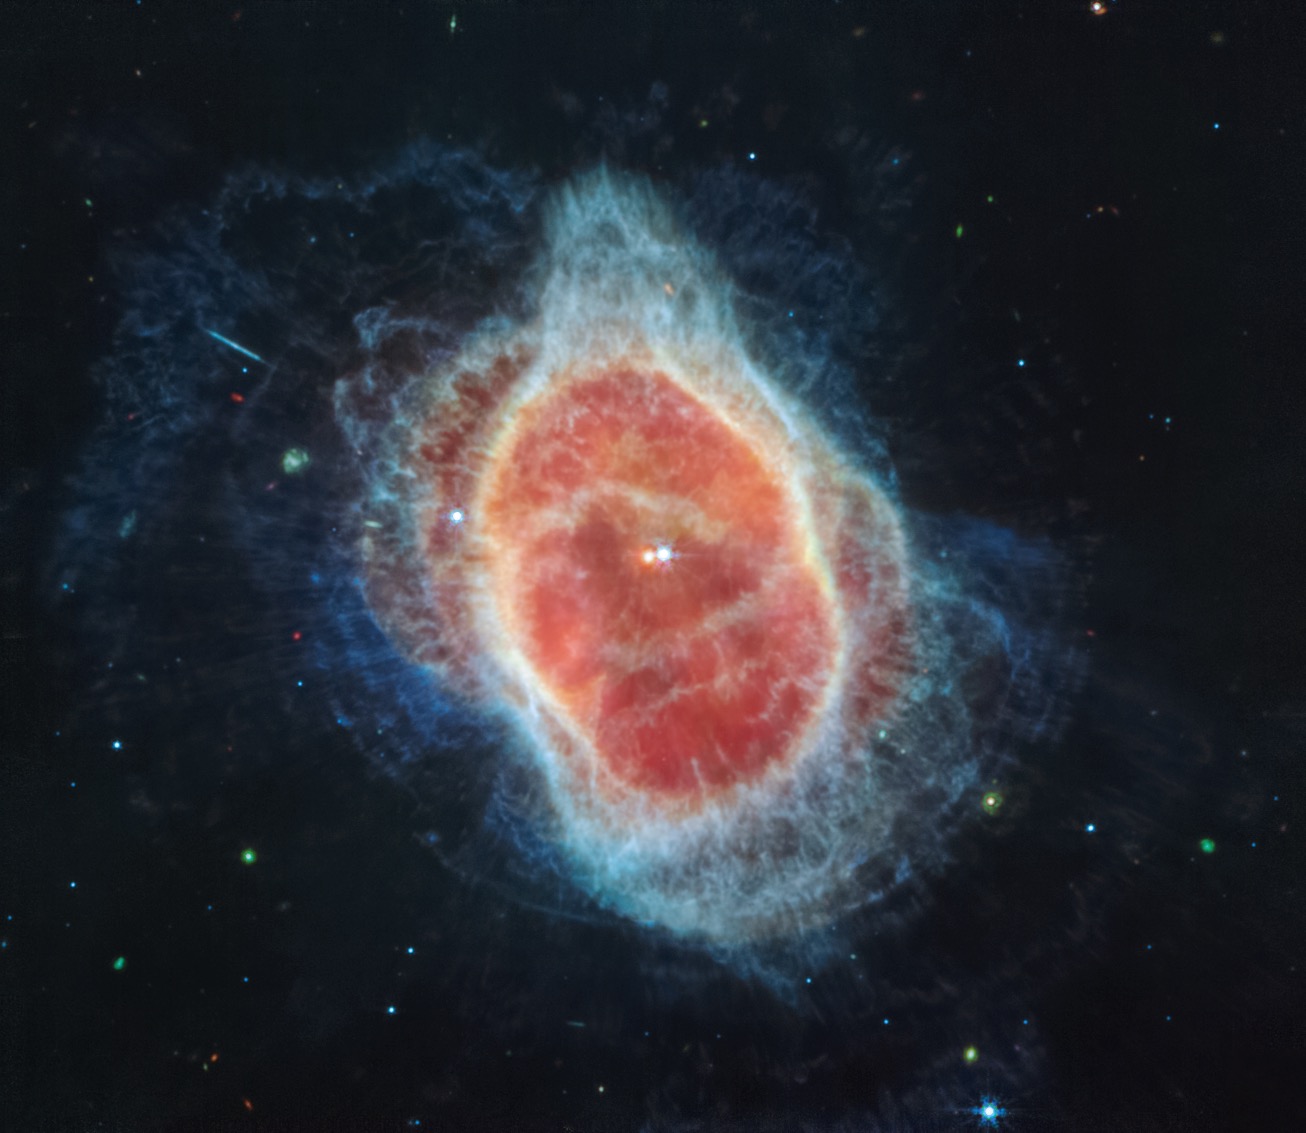
NASA’s Webb Telescope has revealed the cloak of dust around the second star, shown at left in red, at the center of the Southern Ring Nebula for the first time. It is a hot, dense white dwarf star. Credits: NASA, ESA, CSA, STScI | › Full image and caption | › Text description (PDF)
Two distinct stars can be seen in this image of the center of the Southern Ring Nebula – a pairing that was believed to exist but was not visible in previous images.
The star pair came into view thanks to the space telescope's MIRI instrument, which is designed to capture wavelengths of light in the mid-infrared range of the electromagnetic spectrum. MIRI’s ability to see in the mid-infrared revealed that the older of the two stars is surrounded by dust. Seeing this dust clearly is what makes the second star visible in the image. While the brighter star is in an earlier stage of its life, it will likely form its own planetary nebula in the future.
About 2,500 light-years away from Earth, the Southern Ring is a planetary nebula – a shell of gas and dust shed from a dying white dwarf star at its center. Its gases stretch out for nearly half a light-year and are speeding away from the star at approximately nine miles per second!

The bright star at the center of NGC 3132, while prominent when viewed by NASA’s Webb Telescope in near-infrared light, plays a supporting role in sculpting the surrounding nebula. A second star, barely visible at lower left along one of the bright star’s diffraction spikes, is the nebula’s source. It has ejected at least eight layers of gas and dust over thousands of years. Credits: NASA, ESA, CSA, STScI | › Full image and caption | › Text description (PDF)
The images from JWST reveal that starlight streams out of the nebula in fine lines, the result of holes in the surrounding gas and dust cloud. The types and locations of different molecules within the cloud, gleaned from the captured spectra, will help to fine tune our understanding of the structure, composition, and history of this nebula, and with future observations, other nebulae.
How Galaxies Interact

An enormous mosaic of Stephan’s Quintet is the largest image to date from NASA’s James Webb Space Telescope, covering about one-fifth of the Moon’s diameter. It contains over 150 million pixels and is constructed from almost 1,000 separate image files. The visual grouping of five galaxies was captured by Webb’s Near-Infrared Camera (NIRCam) and Mid-Infrared Instrument (MIRI). Credits: NASA, ESA, CSA, STScI | › Full image and caption | › Text description (PDF)
The Webb telescope's capabilities bring new eyes to a cluster of galaxies first discovered in 1877 and known as Stephan’s Quintet. On display in this sharp new image are regions of new star birth containing millions of young stars as well as tails of gas, dust, and stars being ripped from galaxies as a result of gravitational forces between the galaxies.
Stephan’s Quintet is a dense cluster of galaxies located 290 million light-years away in the constellation Pegasus. Four of the five galaxies within the quintet are locked in orbits that repeatedly bring them close to one another. The fifth (leftmost) galaxy is seven times closer to Earth than the others. But its location within the line of sight of the distant four makes it appear to be grouped with them. What looks like speckles surrounding the nearby galaxy and could be mistaken for digital noise is actually individual stars from that galaxy.
It may seem distant in pure numbers, but Stephan's Quintet is relatively close compared to galaxies that are billions of light-years away. Its proximity gives astronomers a great view of the interactions that occur between galaxies that are near to each other.
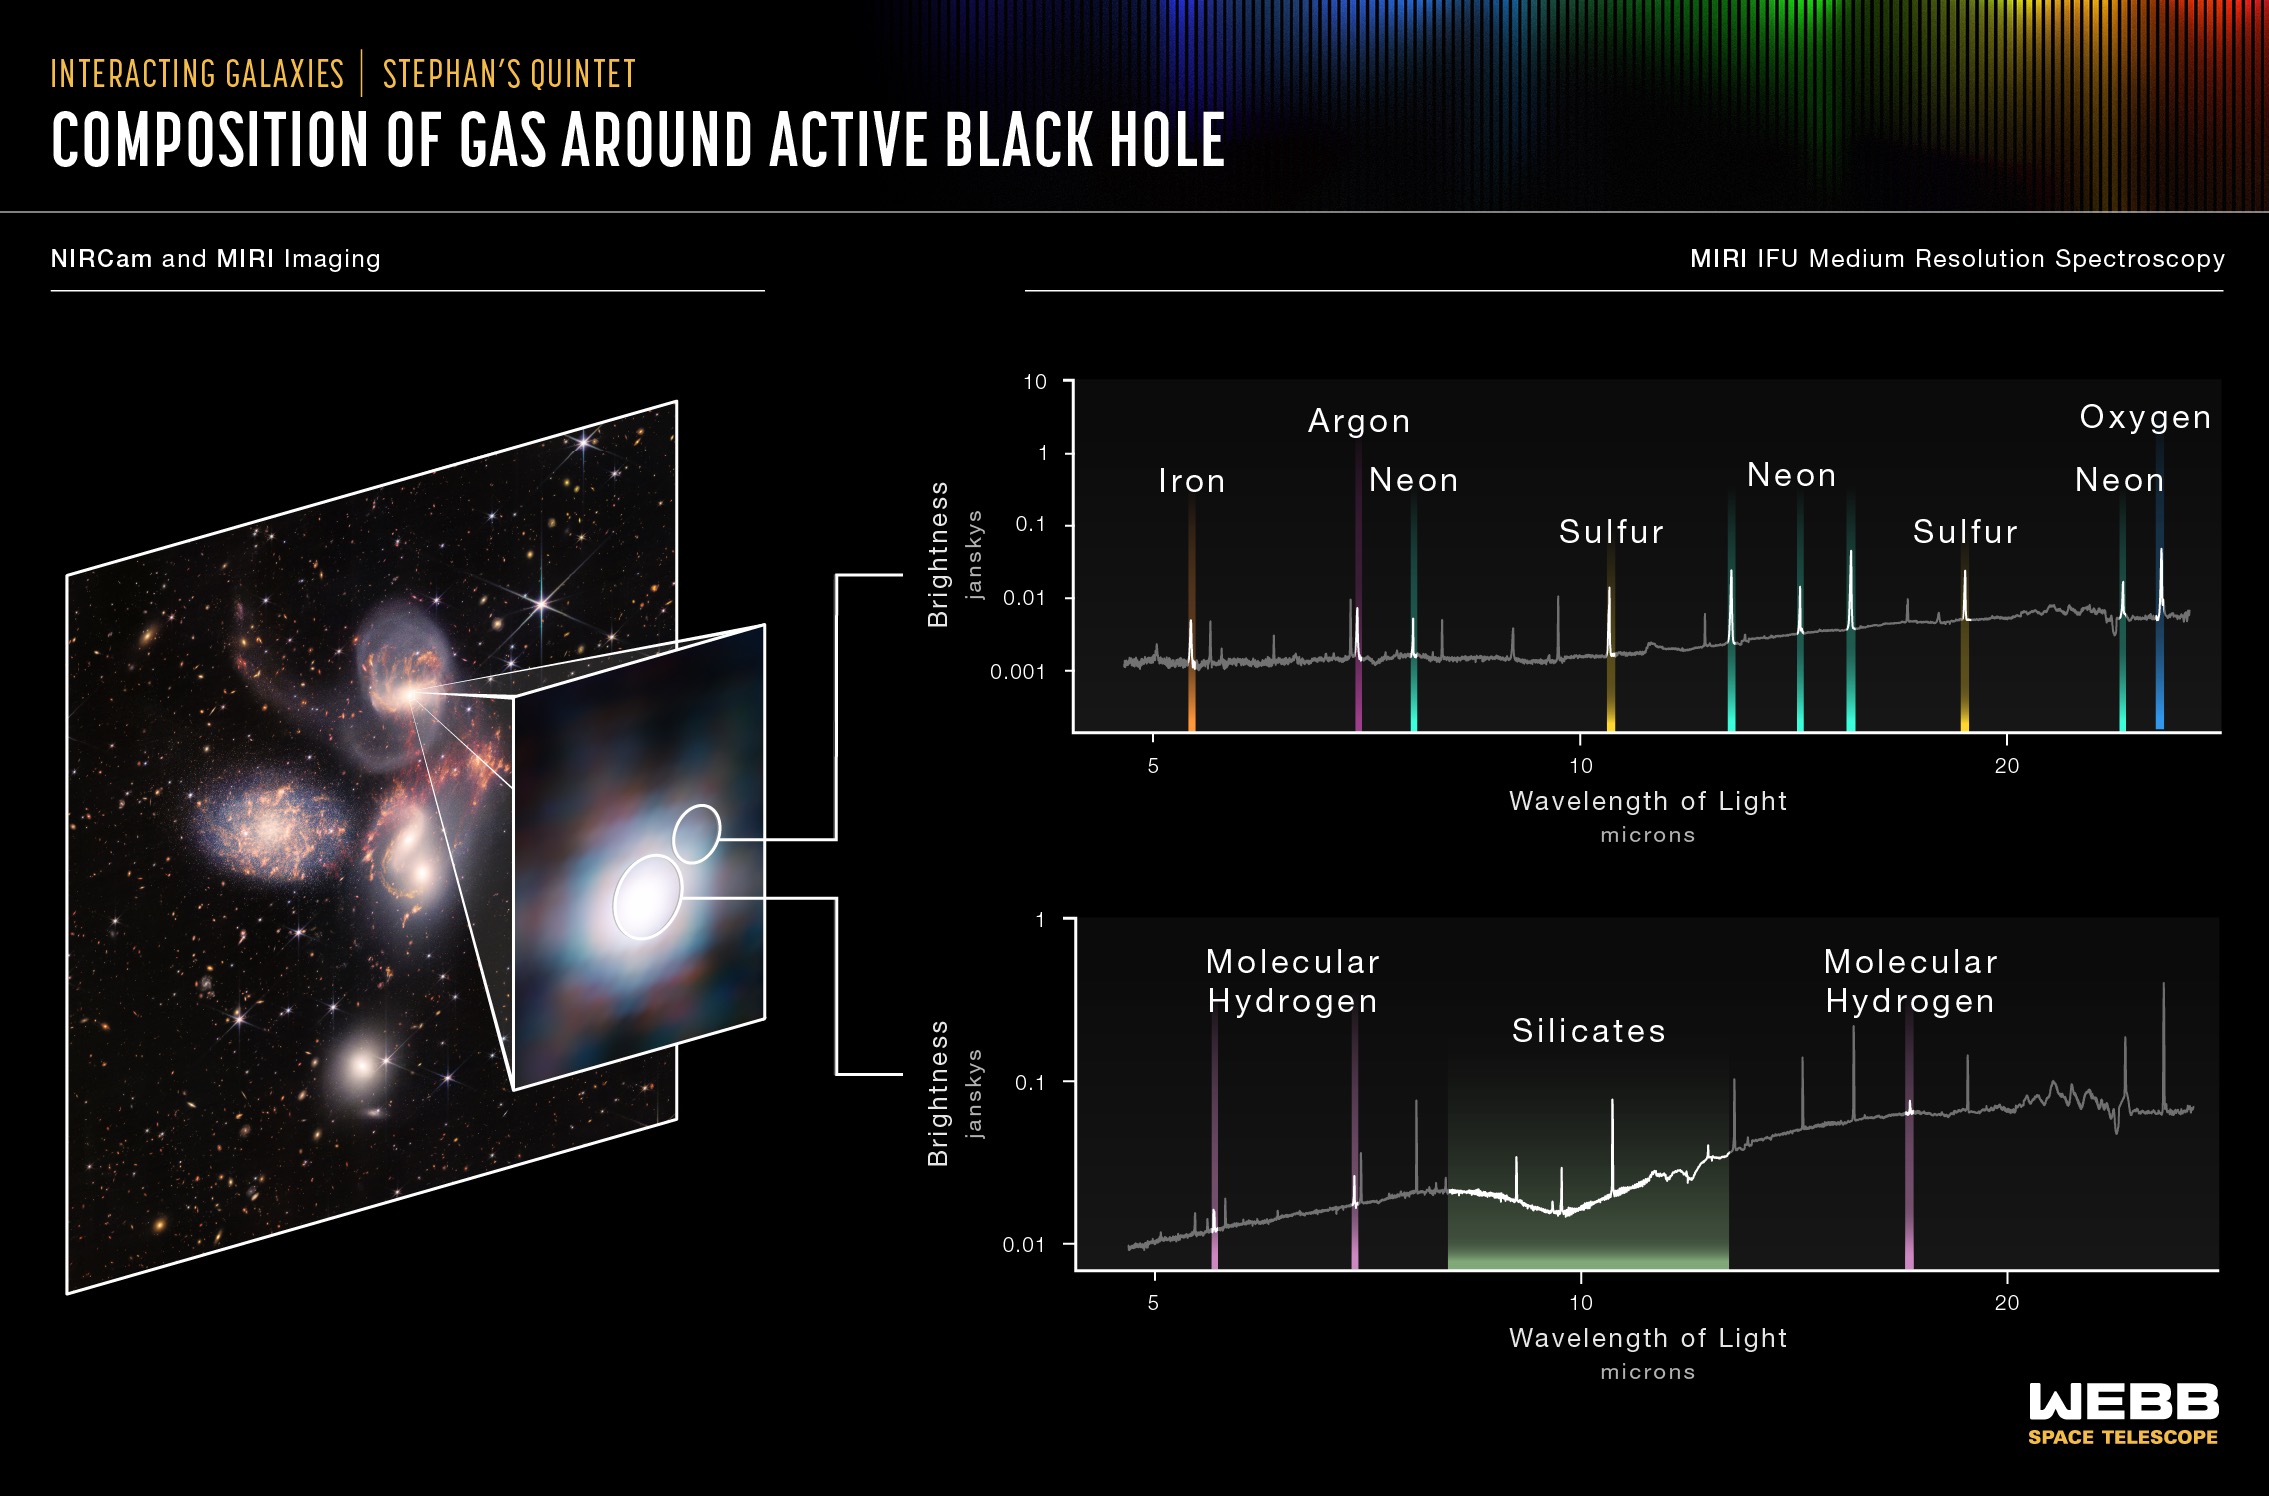
The MIRI instrument measured the composition of gas around the black hole at the center of one of the galaxies in Stephan's Quintent to find a region filled with hot, ionized gases, including iron, argon, neon, sulfur and oxygen (top spectrum). The instrument also revealed that the supermassive black hole has a reservoir of colder, denser gas with large quantities of molecular hydrogen and silicate dust (bottom spectrum). Credits: NASA, ESA, CSA, STScI | › Full image and caption | › Text description (PDF)
The detail exposed will allow scientists to understand the interactions occurring in much more distant – and harder to observe – galaxies. Close inspections of galactic nuclei captured in mid-infrared by the telescope's MIRI instrument revealed hot gas being stripped of its electrons by winds and radiation from a supermassive black hole at the center of one galaxy. The new detail helped scientists determine that iron, argon, neon, sulfur and oxygen, as well as silicate dust are contained in these gases.
Meanwhile, the telescope's NIRSpec instrument – which can capture up to 100 spectra at a time – was able to identify atomic and molecular hydrogen as well as iron ions in the gases around the black hole. These observations will provide a greater understanding about the rate at which supermassive black holes feed and grow.
Thousands of Galaxies in a Grain of Sand
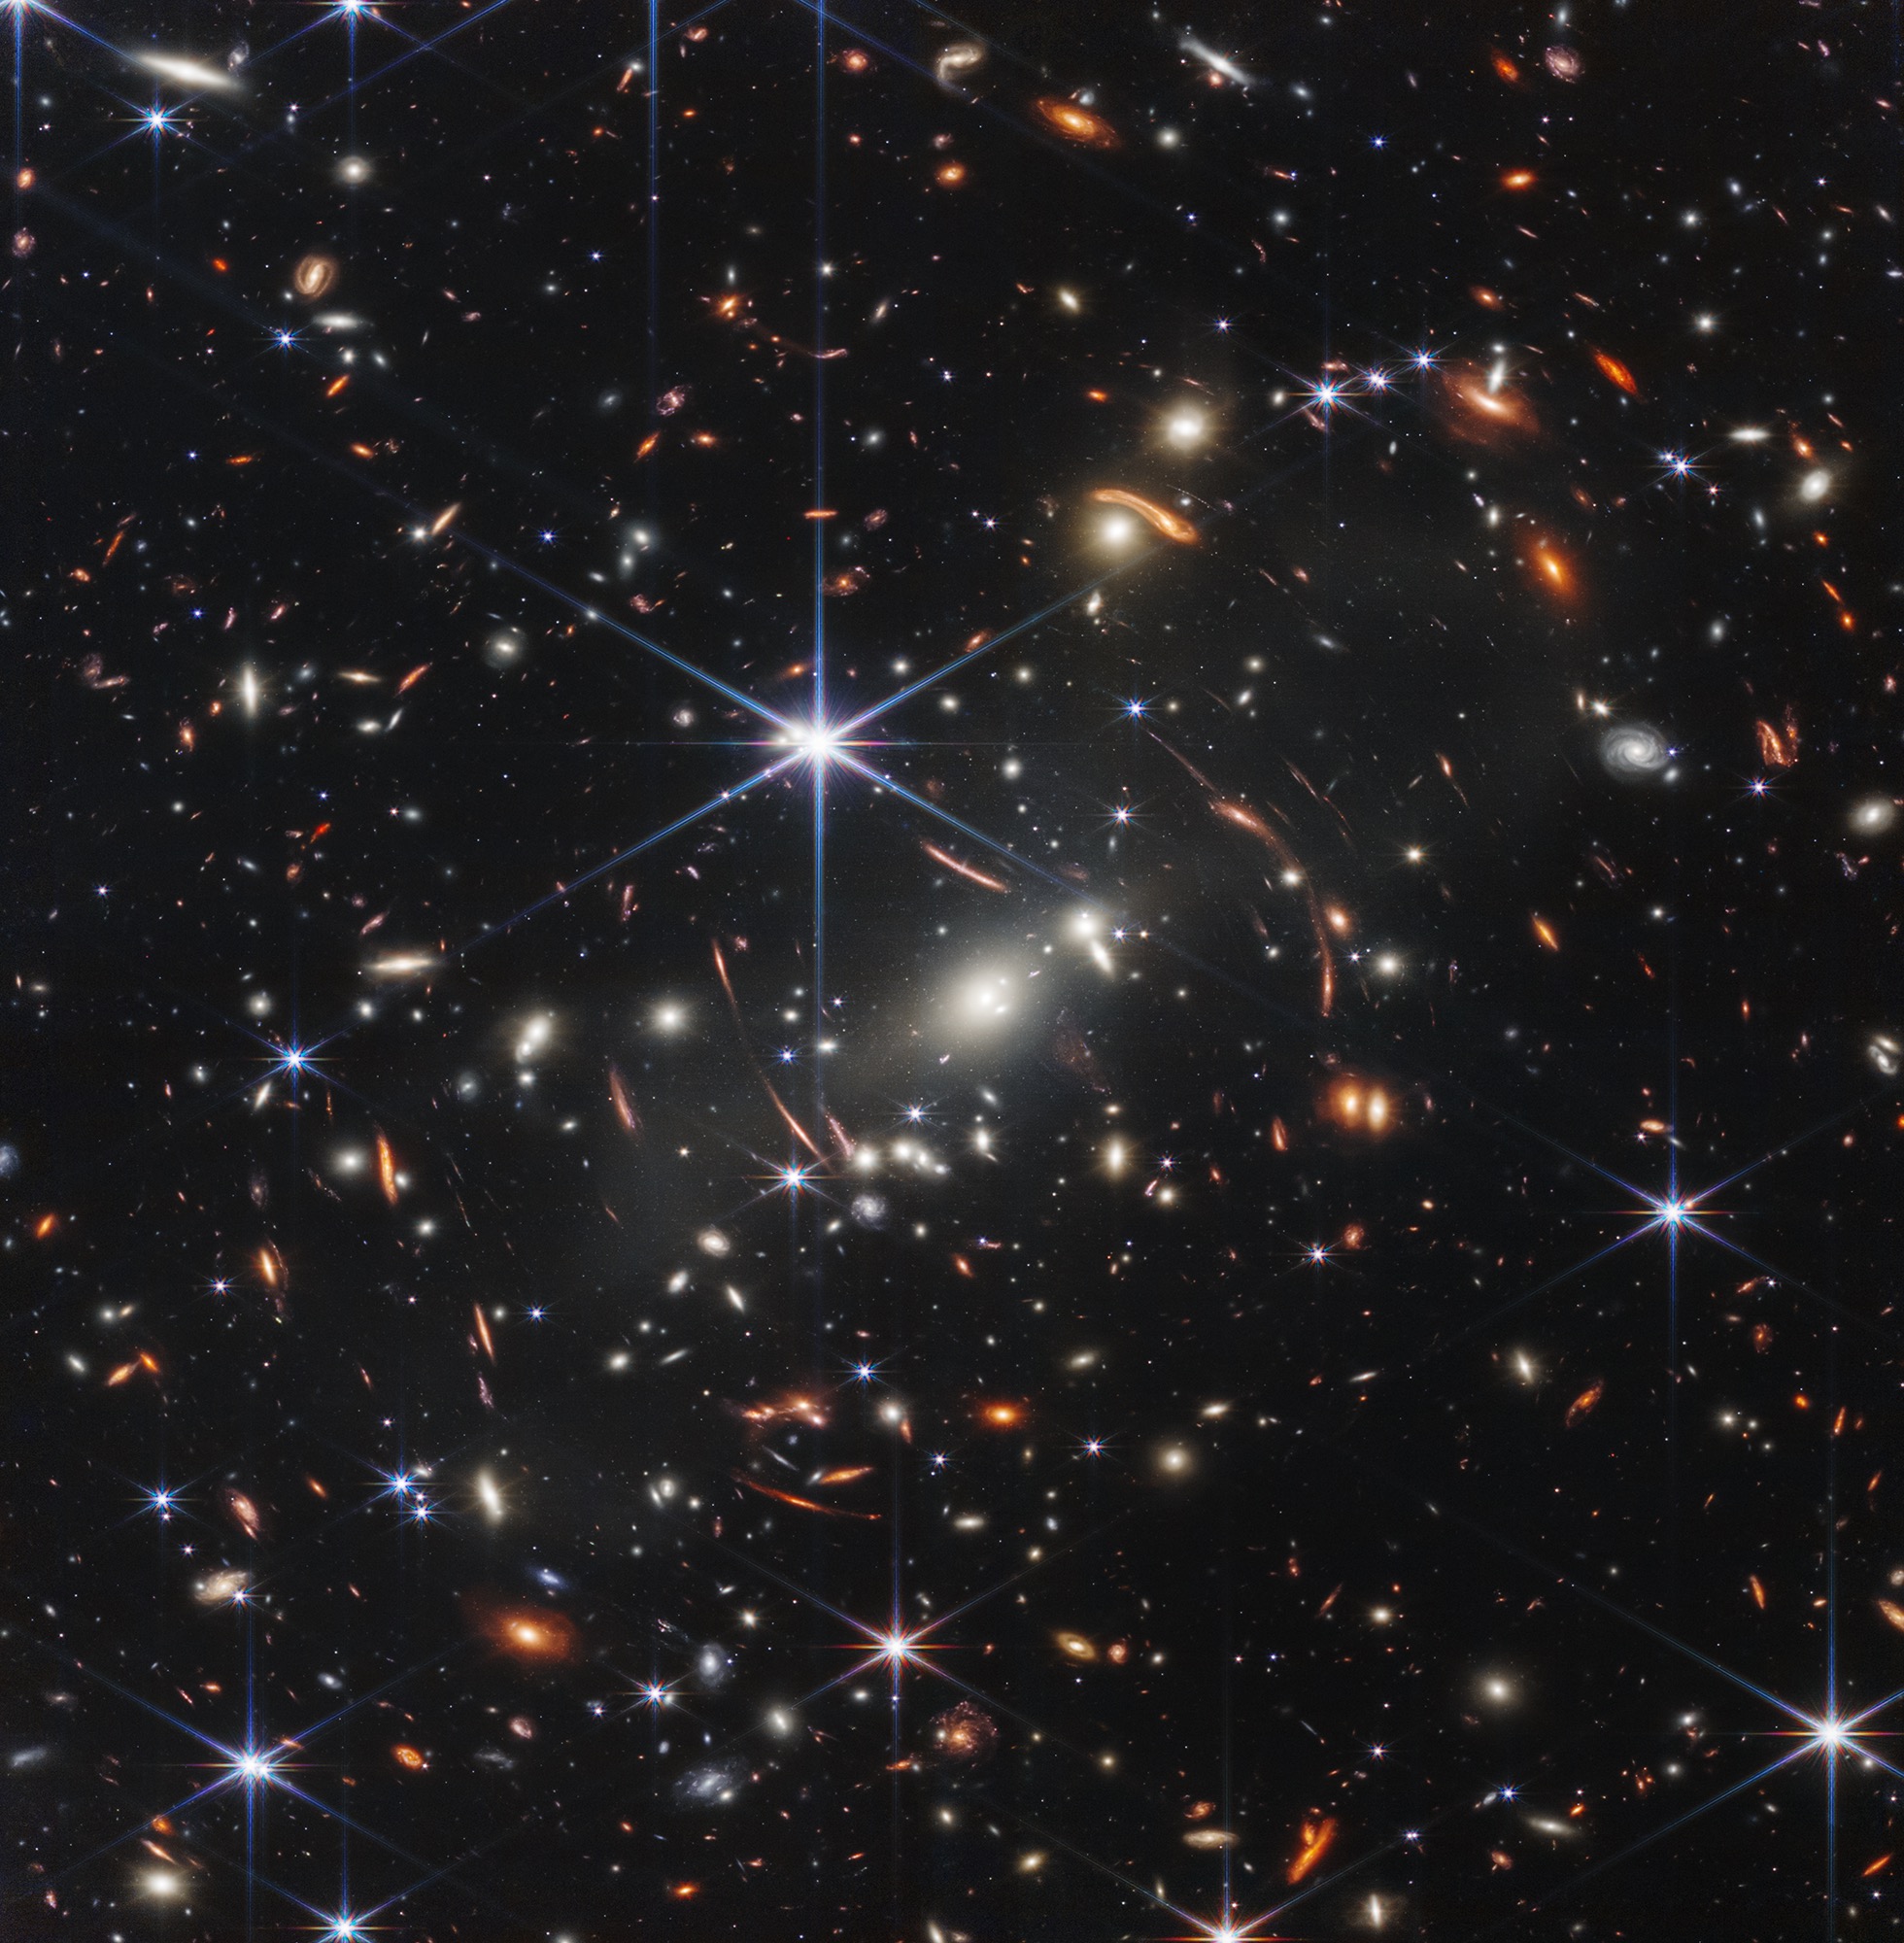
NASA’s James Webb Space Telescope has produced the deepest and sharpest infrared image of the distant universe to date. Known as Webb’s First Deep Field, this image of galaxy cluster SMACS 0723 is overflowing with detail. Credits: NASA, ESA, CSA, STScI | › Full image and caption | › Text description (PDF)
This image contains thousands of galaxies as well as the faintest objects yet observed in the infrared. Known as a deep field image, it was made by pointing the telescope at the target for an extended period of time, allowing the detectors to collect as much of the faint, distant light as possible. JWST captured this deep field image in just 12.5 hours, while the Hubble Space Telescope spent two weeks capturing its deepest images. (Note that Hubble also observed this galaxy cluster, but not as a deep field image.)
Hold a single grain of sand at arm's length and you could cover the entire area of space captured by this image. Keen observers will notice what appear as warped or stretched galaxies. Those are the result of gravitational lensing, a phenomenon in which the gravity of the galaxy cluster centered in the foreground bends the light from background galaxies magnifying and distorting their light. Taking advantage of this phenomenon allows for viewing of extremely distant and very faint galaxies.
The galaxy cluster shown in the image is known as SMACS 0723 and it appears as it did 4.6 billion years ago – the length of time it took for its light to reach the telescope. Light from the oldest-known galaxy in the image had been traveling for 13.1 billion years before it reached JWST.
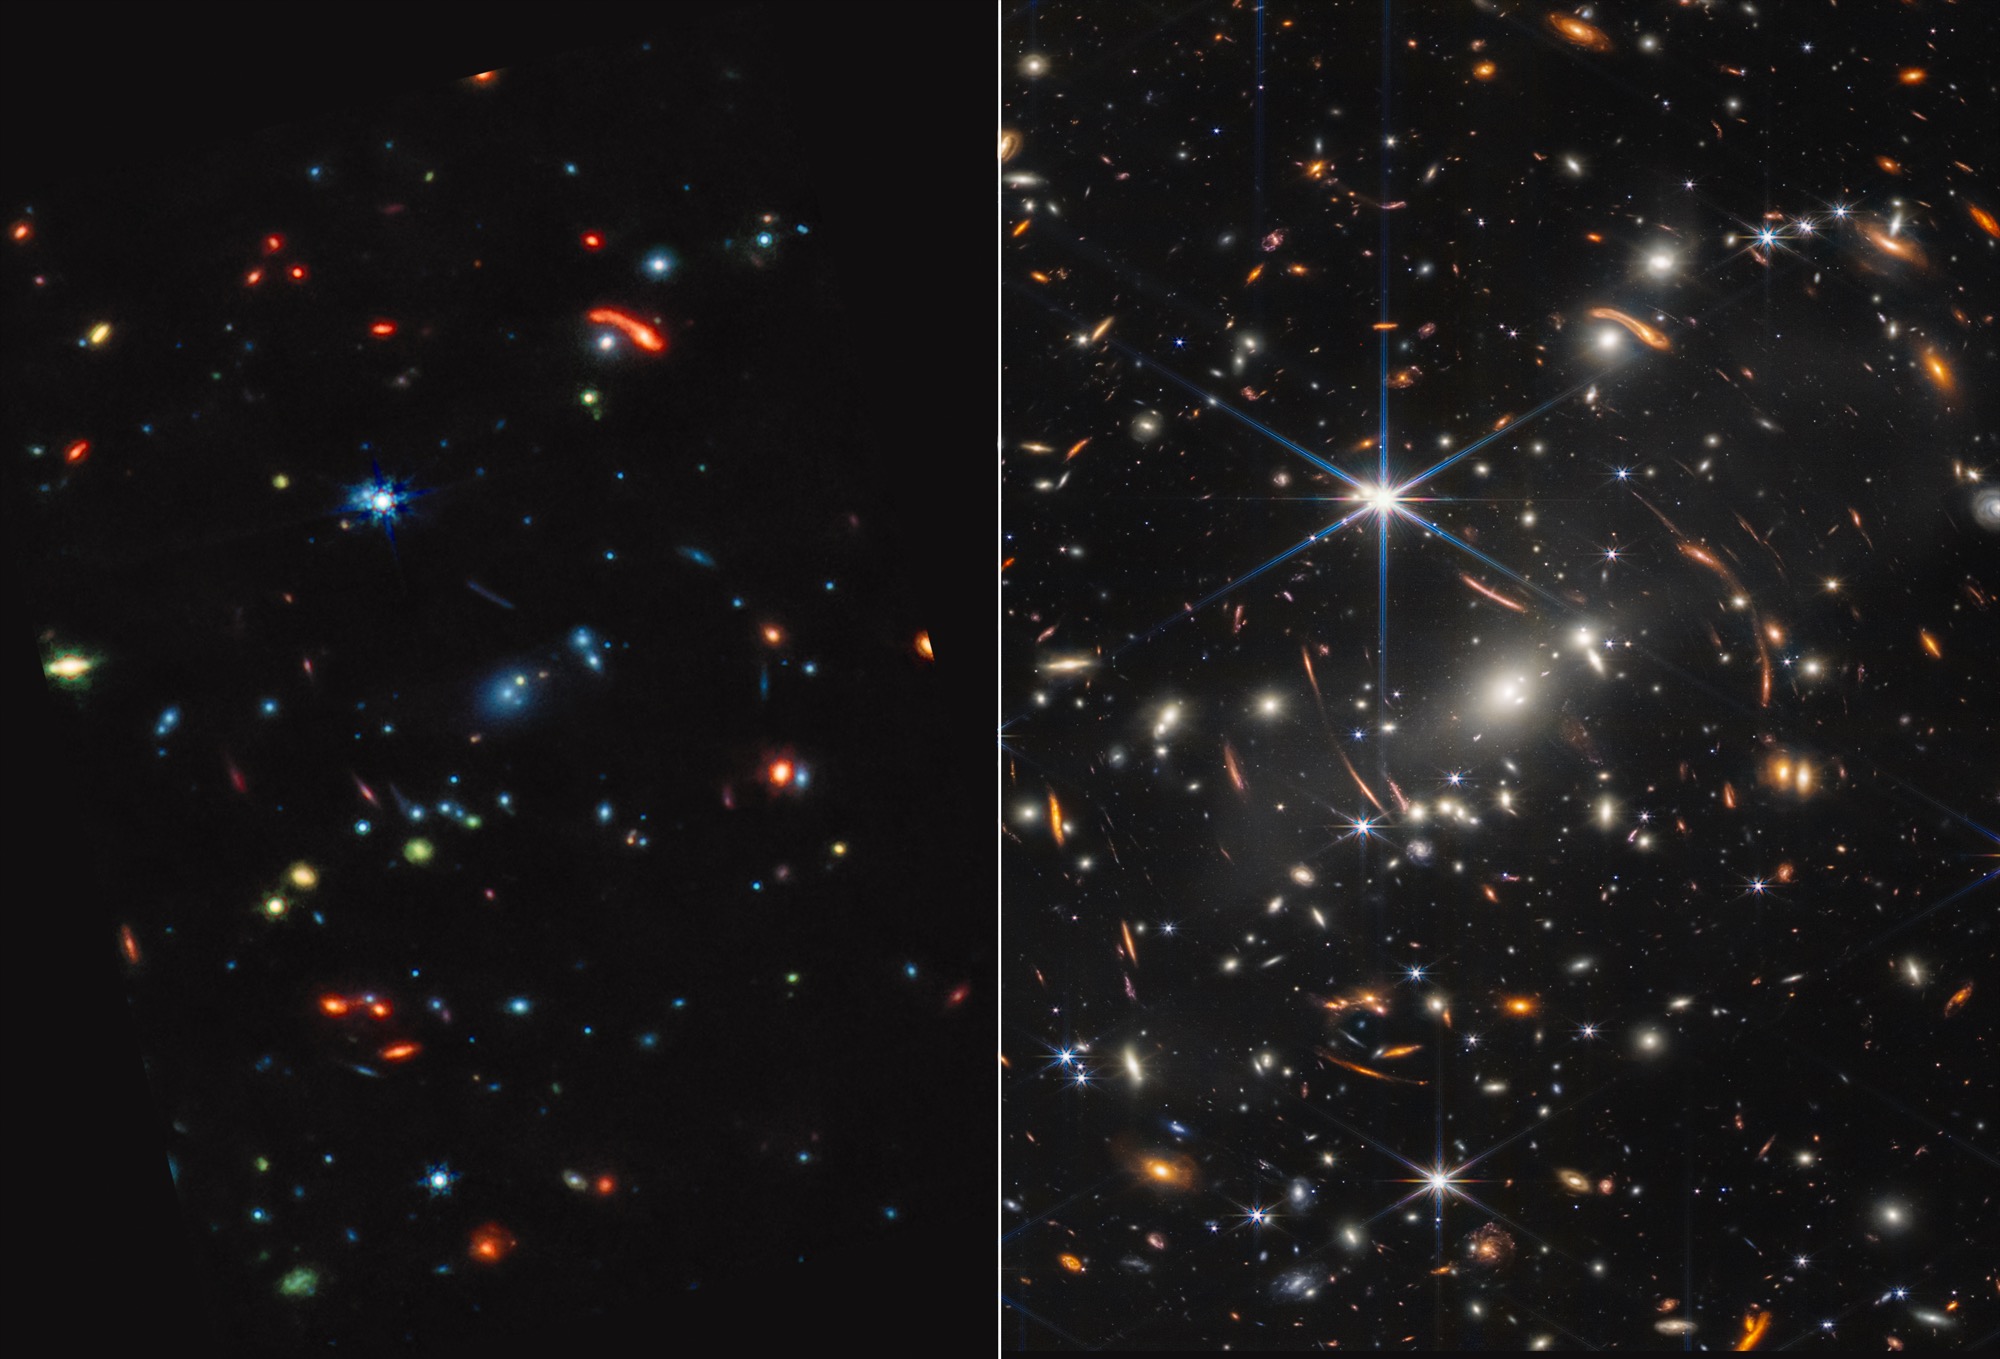
Galaxy cluster SMACS 0723 is a technicolor landscape when viewed in mid-infrared light by NASA’s James Webb Space Telescope. Compared to Webb’s near-infrared image at right, the galaxies and stars are awash in new colors. Credits: NASA, ESA, CSA, STScI | › Full image and caption | › Text description (PDF)
The MIRI instrument’s ability to detect longer infrared wavelengths provides additional information in the image about the make-up of those galaxies. Mid-infrared light highlights dust, an important star-forming ingredient. In this image, red objects contain thick dust layers, while blue galaxies contain stars but not much dust. Green objects contain dust filled with hydrocarbons and other compounds. With these data, astronomers will be able to better understand the formation and growth of galaxies.
As impressive as this image is, the JWST team has plans to capture more deep field images using even longer exposure times. Keep up to date with the latest images and spectra from JWST throughout the school year at the Webb Space Telescope Resource Gallery.
How They Did It
The Webb telescope's ability to detect these objects in such great detail is enabled by its size, the way it observes the universe, and the unique technologies aboard. We went into more detail about how JWST works in a previous Teachable Moment, but below you’ll find a review of some of the important ways JWST was uniquely designed to capture these groundbreaking images.
Observing the Infrared

Light waves get stretched as the universe expands similar to how this ink mark stretches out as the elastic is pulled. Get students modeling and exploring this effect with this standards-aligned math lesson. Credit: NASA/JPL-Caltech | + Expand image
The Webb telescope was built with instruments like NIRSpec and MIRI that are sensitive to light in the near- and mid-infrared wavelengths to detect some of the most distant objects in space.
As light from distant objects travels to Earth, the universe expands, something it’s been doing since the Big Bang. The waves that make up the light get stretched as the universe expands. Visible lightwaves from distant objects that you would be able to see with your eyes get stretched out so far that the longer wavelengths shift from visible light into infrared. Scientists refer to this phenomenon as redshift – and the farther away an object is, the more redshift it undergoes.
Gathering Light
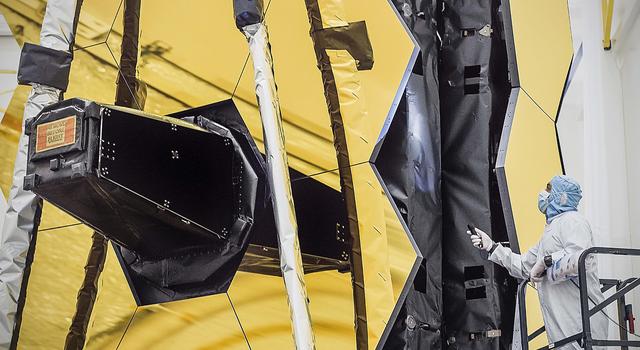
The light from some of these distant objects has traveled so far that it is incredibly dim. To see such dim light, the Webb telescope was built to be extremely sensitive. On the Webb telescope, 18 hexagonal mirrors combine to form a massive primary mirror that is 21 feet (6.5 meters) across – six times the surface area of Hubble.

The complete optical telescope element on display inside a clean room at NASA’s Goddard Space Flight Center in Greenbelt, Maryland, in 2017. Credits: NASA/Desiree Stover | › Full image and caption
To detect faint infrared light, the instruments inside the telescope have to be kept very cold, otherwise those infrared signals could get lost in the heat of the telescope. The spacecraft’s orbit and tennis-court-size sunshield keep light and heat from the Sun, Earth, and Moon from warming up its sensitive instruments. And the MIRI instrument, which needs to be even colder to capture mid-infrared wavelengths, is equipped with a special cryocooler.
The unique design and innovative techniques used by the James Webb Space Telescope are what made the first images possible. As the mission continues, more targets will be observed, more discoveries will be made, and more of our universe will unfold before our eyes.
“It’s not every day you can say you contributed to something that inspires the world in a positive way, but I believe that’s what JWST is doing for everyone of all ages,” said JPL engineer Analyn Schneider, who is the project manager for the telescope's MIRI instrument. “The telescope will help us learn more about our galaxy and the rest of the universe, and as a bonus we get these magnificent images. Learning is a big part of being in science and engineering and that’s what makes it interesting and challenging.”
Teach It
Bring the excitement of these far-off observations closer to home by using the following resources in your learning environment, whether in-person, hybrid, or remote. Scientists and educators directly connected with the James Webb Space Telescope have teamed up to provide a collection of Webb resources to meet your needs. Find additional resources below and through NASA’s Universe of Learning project.
Lessons
-
The Expanded Universe: Playing With Time Activity Guide
In this activity, participants use balloons to model the expansion of the universe and observe how expansion affects wavelengths of light and distance between galaxies.
-

Modeling the Orbits of Planets
Students use a planar model of a gravity well to create different orbital configurations around a central mass.
Subject Science
Grades 6-12
Time 30-60 mins
-
Math of the Expanding Universe
Students will learn about the expanding universe and the redshift of lightwaves, then perform their own calculations with a distant supernova.
Subject Science
Grades 9-12
Time 30-60 mins
-
The Science of Color
Quickly and easily model how colors reflect, absorb, and interact with each other in the classroom or online using your computer’s camera.
Subject Science
Grades 2-8
Time < 30 mins
-
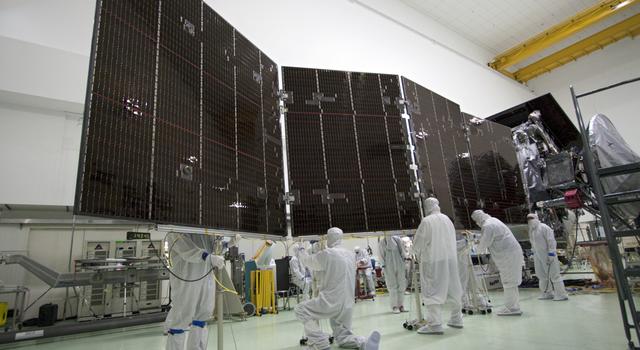
Calculating Solar Power in Space
Students explore practical applications of exponents and division to investigate what it takes for NASA spacecraft to travel deep into the solar system using only solar power.
Subject Math
Grades 6-8
Time 30-60 mins
-
Using Light to Study Planets
Students build a spectrometer using basic materials as a model for how NASA uses spectroscopy to determine the nature of elements found on Earth and other planets.
Subject Science
Grades 6-11
Time > 2 hrs
-
Collecting Light: Inverse Square Law Demo
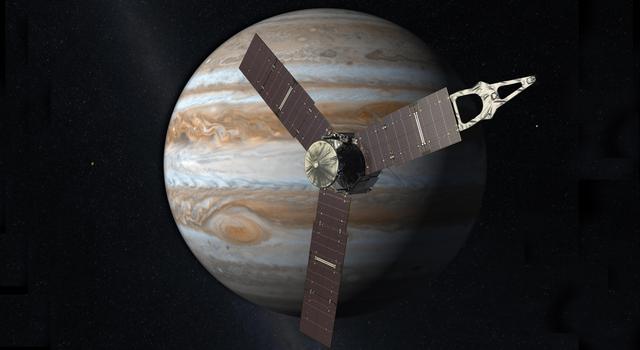
In this activity, students learn how light and energy are spread throughout space. The rate of change can be expressed mathematically, demonstrating why spacecraft like NASA’s Juno need so many solar panels.
Subject Math
Grades 6-12
Time < 30 mins
-
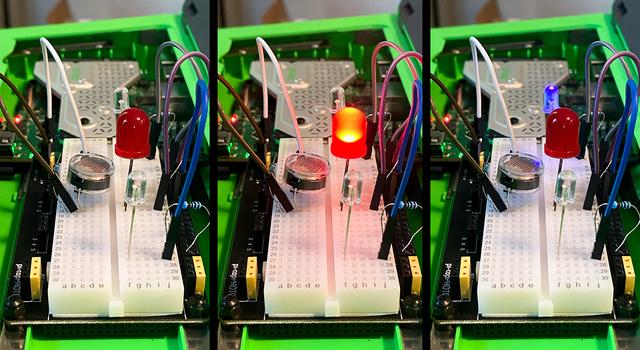
Build a Light Detector Inspired by Space Communications
In this advanced programming activity, students will construct a light-wavelength detector to model future technology for communicating with spacecraft.
Subject Technology
Grades 9-12
Time > 2 hrs
-

James Webb Space Telescope STEM Toolkit
Find a collection of resources, activities, videos, and more for your students to learn about NASA’s newest space observatory.
Student Activities
Explore More
-
Planet Pinpointer: A 'Pi in the Sky' Math Challenge
In this illustrated math problem, students use pi to calculate the distance across a disk of debris around the star Beta Pictoris.
Subject Math
Grades 10-12
Time < 30 mins
-
 Teachable Moments
How Scientists Captured the First Image of a Black Hole
Find out how scientists created a virtual telescope as large as Earth itself to capture the first image of a black hole's silhouette.
-
 Expert Talk
Teaching Space With NASA – Revealing the Universe With Infrared
In this educational talk, NASA experts discuss how we use non-visible light to explore the universe.
-
Black Holes: By the Numbers
What are black holes and how do they form? Explore more in this slideshow for students.
Subject Science
Grades 4-12
Time < 30 mins
- Slide Deck: James Webb Space Telescope
- Sonification: Exoplanet WASP-96b Spectra
- Interactive: The James Webb Space Telescope Virtual Experience
- Gallery: Cool Cosmos Infrared Galaxy
- Interactive: Viewspace – Star Formation: Eagle Nebula
- Article for Kids: What is a Transit?
- Article for Kids: What is a Light Year?
- Article for Kids: What is a Nebula?
- Article for Kids: What is a Black Hole?
- Article for Kids: What is a Galaxy?
- Article for Kids: Explore the Electromagnetic Spectrum
- Article for Kids: How Old are Galaxies?
- Website: James Webb Space Telescope
- Image Gallery: James Webb Space Telescope Images
- Website: NASA Exoplanets
- Interactive: Eyes on Exoplanets
- Facts & Figures: Exoplanet Catalog
- Downloads: James Webb Space Telescope Poster
- Downloads: Exoplanet Travel Bureau Posters
- Webb Telescope Videos
- Webb Telescope Paper Model
NASA's Universe of Learning materials are based upon work supported by NASA under award number NNX16AC65A to the Space Telescope Science Institute, working in partnership with Caltech/IPAC, Center for Astrophysics | Harvard & Smithsonian, and the Jet Propulsion Laboratory.
TAGS: Stars & Galaxies, JWST, K-12 Education, Teaching, Universe of Learning

Teachable Moments | May 12, 2022
Telescopes Get Extraordinary View of Milky Way's Black Hole
Find out how scientists captured the first image of Sagittarius A*, why it's important, and how to turn it into a learning opportunity for students.
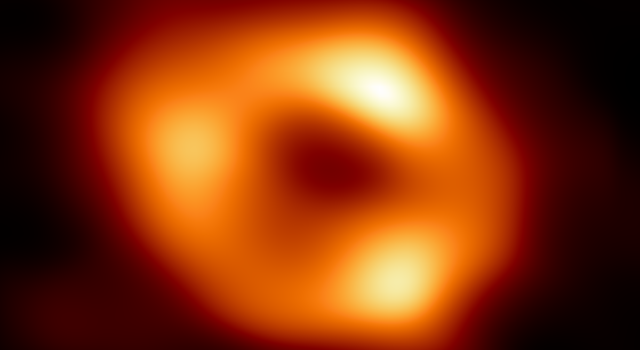
Our home galaxy, the Milky Way, has a supermassive black hole at its center, but we’ve never actually seen it – until now. The Event Horizon Telescope, funded by the National Science Foundation, has released the first image of our galactic black hole, Sagittarius A* (pronounced “Sagittarius A-star” and abbreviated Sgr A*).
Read on to find out how the image was acquired and learn more about black holes and Sagittarius A*. Then, explore resources to engage learners in the exciting topic of black holes.
How Black Holes Work
A black hole is a location in space with a gravitational pull so strong that nothing, not even light, can escape it. A black hole’s outer edge, called its event horizon, defines the spherical boundary where the velocity needed to escape exceeds the speed of light. Matter and radiation fall in, but they can’t get out. Because not even light can escape, a black hole is literally black. Contrary to their name’s implication, black holes are not empty. In fact, a black hole contains a great amount of matter packed into a relatively small space. Black holes come in various sizes and can exist throughout space.
We can surmise a lot about the origin of black holes from their size. Scientists know how some types of black holes form, yet the formation of others is a mystery. There are three different types of black holes, categorized by their size: stellar-mass, intermediate-mass, and supermassive black holes.
Stellar-mass black holes are found throughout our Milky Way galaxy and have masses less than about 100 times that of our Sun. They comprise one of the possible endpoints of the lives of high-mass stars. Stars are fueled by the nuclear fusion of hydrogen, which forms helium and other elements deep in their interiors. The outflow of energy from the central regions of the star provides the pressure necessary to keep the star from collapsing under its own weight.
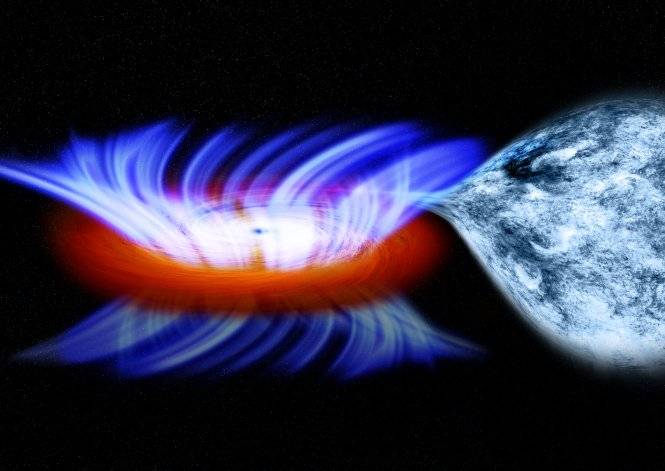
This illustration shows a binary system containing a stellar-mass black hole called IGR J17091-3624. The strong gravity of the black hole, on the left, is pulling gas away from a companion star on the right. This gas forms a disk of hot gas around the black hole, and the wind is driven off this disk. Image credit: NASA/CXC/M.Weiss | › Full image and caption
Once the fuel in the core of a high-mass star has completely burned out, the star collapses, sometimes producing a supernova explosion that releases an enormous amount of energy, detectable across the electromagnetic spectrum. If the star’s mass is more than about 25 times that of our Sun, a stellar-mass black hole can form.
Intermediate-mass black holes have masses between about 100 and 100,000 times that of our Sun. Until recently, the existence of intermediate-mass black holes had only been theorized. NASA’s Chandra X-ray Observatory has identified several intermediate-mass black hole candidates by observing X-rays emitted by the gas surrounding the black hole. The Laser Interferometer Gravitational Wave Observatory, or LIGO, funded by the National Science Foundation, detected the merger of two stellar-mass black holes with masses 65 and 85 times that of our Sun forming an intermediate-mass black hole of 142 solar masses. (Some of the mass was converted to energy and about nine solar masses were radiated away as gravitational waves.)
Supermassive black holes contain between a million and a billion times as much mass as a stellar-mass black hole. Scientists are uncertain how supermassive black holes form, but one theory is that they result from the combining of stellar-mass black holes.

This chart illustrates the relative masses of super-dense cosmic objects, ranging from white dwarfs to the supermassive black holes encased in the cores of most galaxies. | › Full image and caption
Our local galactic center’s black hole, Sagittarius A*, is a supermassive black hole with a mass of about four million suns, which is fairly small for a supermassive black hole. NASA’s Hubble Space Telescope and other telescopes have determined that many galaxies have supermassive black holes at their center.

This image shows the center of the Milky Way galaxy along with a closer view of Sagittarius A*. It was made by combining X-ray images from NASA's Chandra X-ray Observatory (blue) and infrared images from the agency's Hubble Space Telescope (red and yellow). The inset shows Sgr A* in X-rays only, covering a region half a light year wide. Image credit: X-ray: NASA/UMass/D.Wang et al., IR: NASA/STScI | › Full image and caption
Why They're Important
Black holes hold allure for everyone from young children to professional astronomers. For astronomers, in particular, learning about Sagittarius A* is important because it provides insights into the formation of our galaxy and black holes themselves.
Understanding the physics of black hole formation and growth, as well as their surrounding environments, gives us a window into the evolution of galaxies. Though Sagittarius A* is more than 26,000 light years (152 quadrillion miles) away from Earth, it is our closest supermassive black hole. Its formation and physical processes influence our galaxy as galactic matter continually crosses the event horizon, growing the black hole’s mass.
Studying black holes also helps us further understand how space and time interact. As one gets closer to a black hole, the flow of time slows down compared with the flow of time far from the black hole. In fact, according to Einstein’s theory of general relativity, the flow of time slows near any massive object. But it takes an incredibly massive object, such as a black hole, to make an appreciable difference in the flow of time. There's still much to learn about what happens to time and space inside a black hole, so the more we study them, the more we can learn.
How Scientists Imaged Sagittarius A*
Black holes, though invisible to the human eye, can be detected by observing their effects on nearby space and matter. As a result of their enormous mass, black holes have extremely high gravity, which pulls in surrounding material at rapid speeds, causing this material to become very hot and emit X-rays.
This video explains how Sagittarius A* appears to still have the remnants of a blowtorch-like jet dating back several thousand years. Credit: NASA | Watch on YouTube
X-ray-detecting telescopes such as NASA’s Chandra X-ray Observatory can image the material spiraling into a black hole, revealing the black hole’s location. NASA’s Hubble Space Telescope can measure the speed of the gas and stars orbiting a point in space that may be a black hole. Scientists use these measurements of speed to determine the mass of the black hole. Hubble and Chandra are also able to image the effects of gravitational lensing, or the bending of light that results from the gravitational pull of black holes or other high-mass objects such as galaxies.

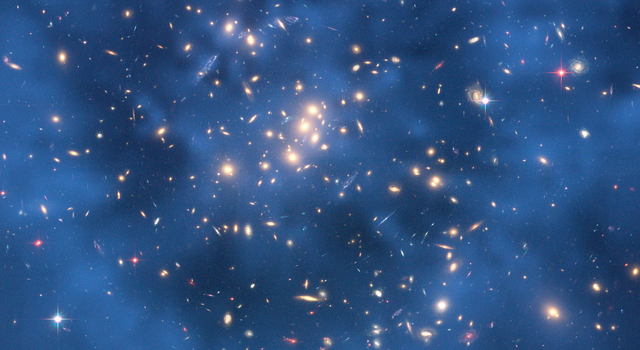
The thin blue bull's-eye patterns in this Hubble Space Telescope image are called "Einstein rings." The blobs are giant elliptical galaxies roughly 2 to 4 billion light-years away. And the bull's-eye patterns are created as the light from galaxies twice as far away is distorted into circular shapes by the gravity of the giant elliptical galaxies. | › Full image and caption
To directly image the matter surrounding a black hole, thus revealing the silhouette of the black hole itself, scientists from around the world collaborated to create the Event Horizon Telescope. The Event Horizon Telescope harnesses the combined power of numerous telescopes around the world that can detect radio-wave emissions from the sky to create a virtual telescope the size of Earth.
Narrated by Caltech’s Katie Bouman, this video explains how she and her fellow teammates at the Event Horizon Telescope project managed to take a picture of Sagittarius A* (Sgr A*), a beastly black hole lying 27,000 light-years away at the heart of our Milky Way galaxy. Credit: Caltech | Watch on YouTube
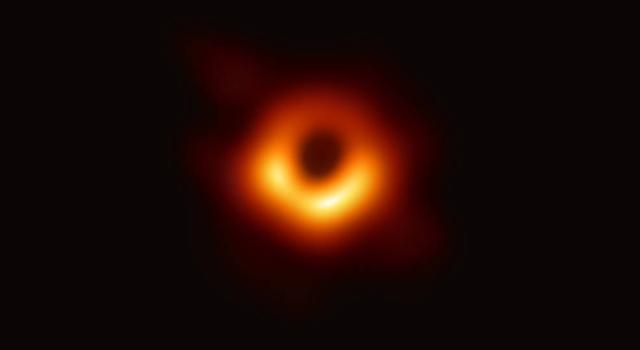
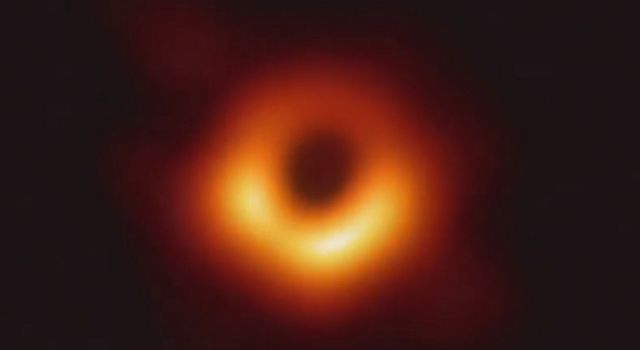
In 2019, the team released the first image of a black hole's silhouette when they captured the glowing gasses surrounding the M87* galactic black hole nearly 53 million light-years (318 quintillion miles) away from Earth. The team then announced that one of their next endeavors was to image Sagittarius A*.
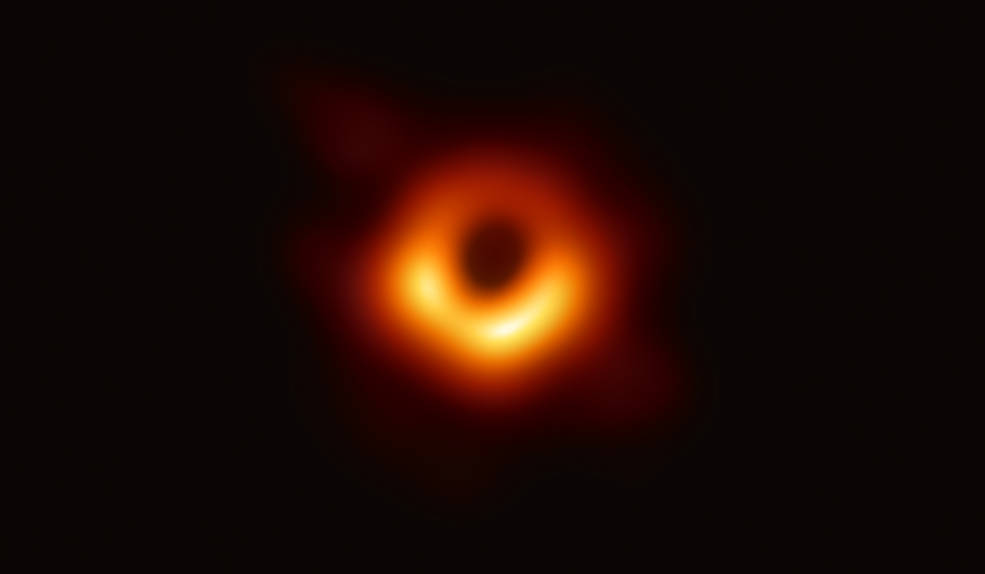
Captured by the Event Horizon Telescope in 2019, this image of the the glowing gasses surrounding the M87* black hole, was the first image ever captured of a black hole. Image credit: Event Horizon Telescope Collaboration | + Expand image
To make the newest observation, the Event Horizon Telescope focused its array of observing platforms on the center of the Milky Way. A telescope array is a group of telescopes arranged so that, as a set, they function similarly to one giant telescope. In addition to the telescopes used to acquire the M87* image, three additional radio telescopes joined the array to acquire the image of Sagittarius A*: the Greenland Telescope, the Kitt Peak 12-meter Telescope in Arizona, and the NOrthern Extended Millimeter Array, or NOEMA, in France.
This image of the center of our Milky Way galaxy representing an area roughly 400 light years across, has been translated into sound. Listen for the different instruments representing the data captured by the Chandra X-ray Observatory, Hubble Space Telescope, and Spitzer Space Telescope. The Hubble data outline energetic regions where stars are being born, while Spitzer's data captures glowing clouds of dust containing complex structures. X-rays from Chandra reveal gas heated to millions of degrees from stellar explosions and outflows from Sagittarius A*. Credit: Chandra X-ray Observatory | Watch on YouTube
The distance from the center of Sagittarius A* to its event horizon, a measurement known as the Schwarzschild radius, is enormous at seven million miles (12,000,000 kilometers or 0.08 astronomical units). But its apparent size when viewed from Earth is tiny because it is so far away. The apparent Schwarzschild radius for Sagittarius A* is 10 microarcseconds, about the angular size of a large blueberry on the Moon.
Acquiring a good image of a large object that appears tiny when viewed from Earth requires a telescope with extraordinarily fine resolution, or the ability to detect the smallest possible details in an image. The better the resolution, the better the image and the more detail the image will show. Even the best individual telescopes or array of telescopes at one location do not have a good enough resolution to image Sagittarius A*.
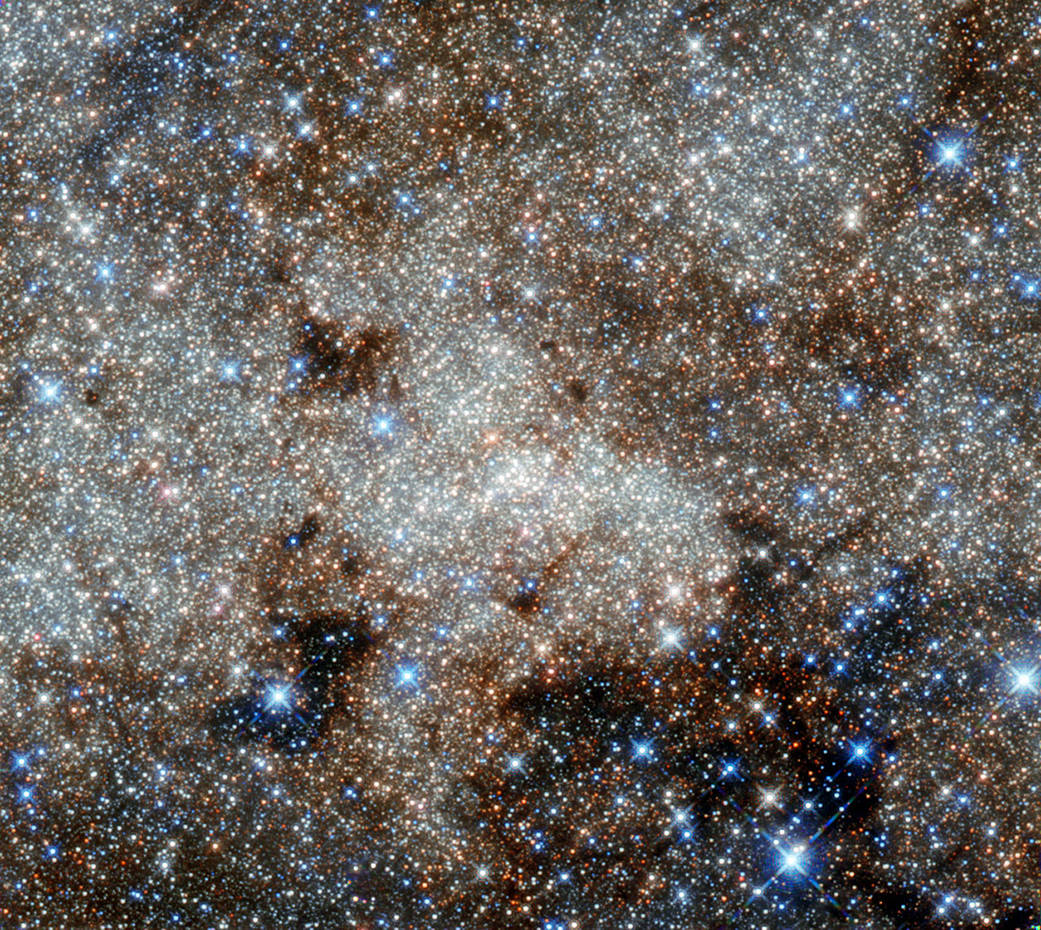
This image captured by NASA's Hubble Space Telescope shows the star-studded center of the Milky Way towards the constellation of Sagittarius. Even though you can't see our galaxy's central black hole directly, you might be able to pinpoint its location based on what you've learned about black holes thusfar. Image credit: NASA, ESA, and G. Brammer | › Full image and caption
The addition of the 12-meter Greenland Telescope, though a relatively small instrument, widened the diameter, or aperture, of the Event Horizon Telescope to nearly the diameter of Earth. And NOEMA – itself an array of twelve 15-meter antennas with maximum separation of 2,500 feet (760 meters) – helped further increase the Event Horizon Telescope’s light-gathering capacity.
Altogether, when combined into the mighty Event Horizon Telescope, the virtual array obtained an image of Sagittarius A* spanning about 50 microarcseconds, or about 1/13th of a billionth the span of the night sky.

Sagittarius A* is more than 26,000 light years (152 quadrillion miles) away from Earth and has the mass of 4 million suns. Image credit: Event Horizon Telescope | › Full image and caption
While the Event Horizon Telescope was busy capturing the stunning radio image of Sagittarius A*, an additional worldwide contingent of astronomical observatories was also focused on the black hole and the region surrounding it. The aim of the team, known as the Event Horizon Telescope Multiwavelength Science Working Group, was to observe the black hole in other parts of the electromagnetic spectrum beyond radio. As part of the effort, X-ray data were collected by NASA’s Chandra X-ray Observatory, Nuclear Spectroscopic Telescope (NuSTAR), and Neil Gehrels Swift Observatory, additional radio data were collected by the East Asian Very Long-Baseline Interferometer (VLBI) network and the Global 3 millimeter VLBI array, and infrared data were collected by the European Southern Observatory’s Very Large Telescope.
The data from these multiple platforms will allow scientists to continue building their understanding of the behavior of Sagittarius A* and to refine their models of black holes in general. The data collected from these multiwavelength observations are crucial to the study of black holes, such as the Chandra data revealing how quickly material falls in toward the disk of hot gas orbiting the black hole’s event horizon. Data such as these will hopefully help scientists better understand black hole accretion, or the process by which black holes grow.
Teach It
Check out these resources to bring the real-life STEM of black holes into your teaching, plus learn about opportunities to involve students in real astronomy research.
-
Educator Guide: Dropping In With Gravitational Waves
Students develop a model to represent the collision of two black holes, the gravitational waves that result and the waves' propagation through spacetime.
Subject Science
Grades 6-8
Time 30-60 mins
-
Teachable Moments: How Scientists Captured the First Image of a Black Hole
Find out how scientists created a virtual telescope as large as Earth itself to capture the first image of a black hole's silhouette.
-
Teachable Moments: Gravitational Waves Detected for the First Time
Find out how researchers proved part of Albert Einstein’s Theory of General Relativity, then create a model of the Nobel Prize-winning experiment in the classroom.
Explore More
Articles
-
Teachable Moments: Learn About the Universe With the James Webb Space Telescope
Get a look into the science and engineering behind the largest and most powerful space telescope ever built while exploring ways to engage learners in the mission.
-

JPL Education ‘Teachable Moment’ Inspires Winning Science Fair Project
A “teachable moment” turned into a science fair win for an eighth-grader in Ontario, Canada, who based his project on a classroom activity from NASA’s Jet Propulsion Laboratory.
Educator Guides
Student Activities
Check out these related resources for students from NASA’s Space Place
Across the NASA-Verse
- Educator Guide: Black Hole Math
- NASA/IPAC TeacherArchive Research Program
- Student Resources: Chandra
- Articles: Hubble - Black Holes
- Audio: Sonification of the Milky Way galactic center
- Audio: Sonification of the M87 black hole
- Interactive: Sagittarius A*
- Videos: Hubble - Black Holes
- Website: NASA Science - Black Holes
- Download: A Galaxy Full of Black Holes Presentation
- Expert Talk: Imaging a Black Hole Lecture
- Website: NASA - Black Holes
- Article: Black Hole Image Makes History
- Graphic: Anatomy of a Black Hole
This Teachable Moment was created in partnership with NASA’s Universe of Learning. Universe of Learning materials are based upon work supported by NASA under award number NNX16AC65A to the Space Telescope Science Institute, working in partnership with Caltech/IPAC, Center for Astrophysics | Harvard & Smithsonian, and the Jet Propulsion Laboratory.
TAGS: Black hole, Milky Way, galaxy, universe, stars, teachers, educators, lessons, Teachable Moments, K-12, science

Edu News | December 30, 2019
NASA's 9 Most Teachable Moments This Decade and Beyond

Whether discovering something about our own planet or phenomena billions of miles away, NASA missions and scientists unveiled a vast universe of mysteries this past decade. And with each daring landing, visit to a new world and journey into the unknown came new opportunities to inspire the next generation of explorers. Read on for a look at some of NASA's most teachable moments of the decade from missions studying Earth, the solar system and beyond. Plus, find out what's next in space exploration and how to continue engaging students into the 2020s with related lessons, activities and resources.
1. Earth's Changing Climate

Rising sea levels, shrinking ice caps, higher temperatures and extreme weather continued to impact our lives this past decade, making studying Earth’s changing climate more important than ever. During the 2010s, NASA and National Oceanic and Atmospheric Administration, or NOAA, led the way by adding new Earth-monitoring satellites to their fleets to measure soil moisture and study carbon dioxide levels. Meanwhile, satellites such as Terra and Aqua continued their work monitoring various aspects of the Earth system such as land cover, the atmosphere, wildfires, water, clouds and ice. NASA's airborne missions, such as Operation IceBridge, Airborne Snow Observatory and Oceans Melting Greenland, returned data on water movement, providing decision makers with more accurate data than ever before. But there's still more to be done in the future to understand the complex systems that make up Earth's climate and improve the scientific models that will help the world prepare for a warmer future. Using these missions and the science they're gathering as a jumping-off point, students can learn about the water cycle, build data-based scientific models and develop an understanding of Earth's energy systems.
Explore More
- Climate lessons for educators
- Climate activities for students
- Climate articles from NASA/JPL Edu
- Learn more about NASA climate missions and science
2. Teachable Moments in the Sky
Astronomical events are a sure-fire way to engage students, and this past decade delivered with exciting solar and lunar eclipses that provided real-world lessons about the Sun, the Moon and lunar exploration. The total solar eclipse that crossed the U.S. in 2017 gave students a chance to learn about the dynamic interactions between the Sun and Moon, while brilliant lunar eclipses year after year provided students with lessons in lunar science. There's more to look forward to in the decade ahead as another solar eclipse comes to the U.S. in 2024 – one of nine total solar eclipses around the world in the 2020s. There will be 10 total lunar eclipses in the 2020s, but observing the Moon at any time provides a great opportunity to study celestial patterns and inspire future explorers. Using the lessons below, students can develop and study models to understand the size and scale of the Earth-Moon system, predict future Moon phases and engage in engineering challenges to solve problems that will be faced by future explorers on the Moon!
Explore More
- Moon lessons for educators
- Moon activities for students
- Moon articles from NASA/JPL Edu
- Learn more about NASA Moon missions and science
3. Missions to Mars
The past decade showed us the Red Planet in a whole new light. We discovered evidence that suggests Mars could have once supported ancient life, and we developed a better understanding of how the planet lost much of its atmosphere and surface water. The Opportunity rover continued exploring long past its expected lifespan of 90 days as NASA sent a larger, more technologically advanced rover, Curiosity, to take the next steps in understanding the planet's ability to support life. (Opportunity's nearly 15-year mission succumbed to the elements in 2019 after a global dust storm engulfed Mars, blocking the critical sunlight the rover needed to stay powered.) The InSight lander touched down in 2018 to begin exploring interior features of the Red Planet, including marsquakes, while high above, long-lived spacecraft like the Mars Reconnaissance Orbiter and Mars Odyssey were joined by NASA's MAVEN Orbiter, and missions from the European Space Agency and the Indian Space Research Organization. The next decade on Mars will get a kick-start with the July launch of the souped-up Mars 2020 rover, which will look for signs of ancient life and begin collecting samples designed to one day be returned to Earth. Mars provides students with countless opportunities to do some of the same engineering as the folks at NASA and design ideas for future Mars exploration. They can also use Mars as a basis for coding activities, real-world math, and lessons in biology and geology.
Explore More
- Mars lessons for educators
- Mars activities for students
- Mars articles from NASA/JPL Edu
- Learn more about NASA Mars missions and science
4. Ocean Worlds and the Search for Life
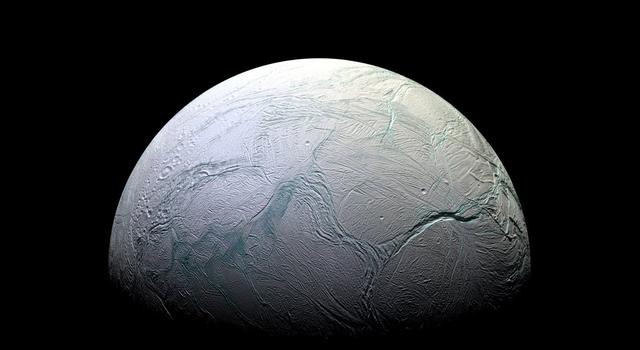
This decade marked the final half of the Cassini spacecraft's 13-year mission at Saturn, during which it made countless discoveries about the planet, its rings and its fascinating moons. Some of the most exciting findings highlighted new frontiers in our search for life beyond Earth. Cassini spotted geysers erupting from cracks in the icy shell of Saturn's moon Enceladus, suggesting the presence of an ocean below. At the moon Titan, the spacecraft peered through the hazy atmosphere to discover an Earth-like hydrologic cycle in which liquid methane and ethane take the place of water. Meanwhile, evidence for another ocean world came to light when the Hubble Space Telescope spotted what appear to be geysers erupting from the icy shell surrounding Jupiter's moon Europa. NASA is currently developing Europa Clipper, a mission that will explore the icy moon of Jupiter to reveal even more about the fascinating world. For students, these discoveries and the moons themselves provide opportunities to build scientific models and improve them as they learn more information. Students can also use math to calculate physical properties of moons throughout the solar system and identify the characteristics that define life as we know it.
Explore More
- Ocean worlds lessons for educators
- Ocean worlds activities for students
- Ocean worlds articles from NASA/JPL Edu
- Learn more about NASA Solar System missions and science
5. Asteroids, Comets and Dwarf Planets, Oh My!

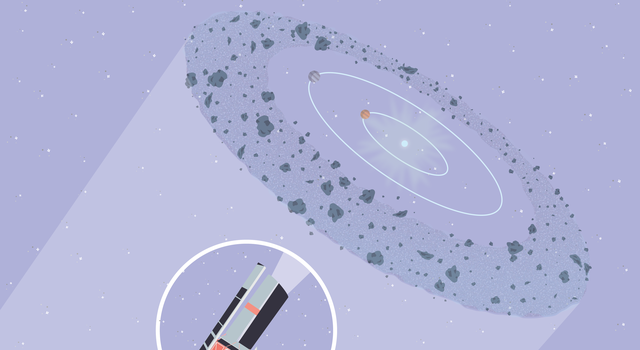
The past decade was a big deal for small objects in space. NASA's Dawn mission started 2010 as a new arrival in the main asteroid belt. The next eight years saw Dawn explore the two largest objects in the asteroid belt, the giant asteroid Vesta and the dwarf planet Ceres. On its way to comet 67P/Churyumov-Gerasimenko, ESA's Rosetta mission (with contributions from NASA) flew by the asteroid Luticia in 2010. After more than two years at its destination – during which time it measured comet properties, captured breathtaking photos and deposited a lander on the comet – Rosetta's mission ended in dramatic fashion in 2016 when it touched down on 67P/Churyumov-Gerasimenko. In 2013, as scientists around the world eagerly anticipated the near-Earth flyby of asteroid Duende, residents of Chelyabinsk, Russia, got a surprising mid-morning wake-up call when a small, previously undetected asteroid entered the atmosphere, burned as a bright fireball and disintegrated. The team from NASA's OSIRIS-Rex mission wrapped up the decade and set the stage for discoveries in 2020 by selecting the site that the spacecraft will visit in the new year to collect a sample of asteroid Bennu for eventual return to Earth. And in 2022, NASA's Psyche mission will launch for a rendezvous with a type of object never before explored up close: a metal asteroid. The small objects in our solar system present students with chances to explore the composition of comets, use math to calculate properties such as volume, density and kinetic energy of asteroids, and use Newton's Laws in real-world applications, such as spacecraft acceleration.
Explore More
- Small objects lessons for educators
- Small objects activities for students
- Learn more about NASA Solar System missions and science
6. Uncovering Pluto's Mysteries
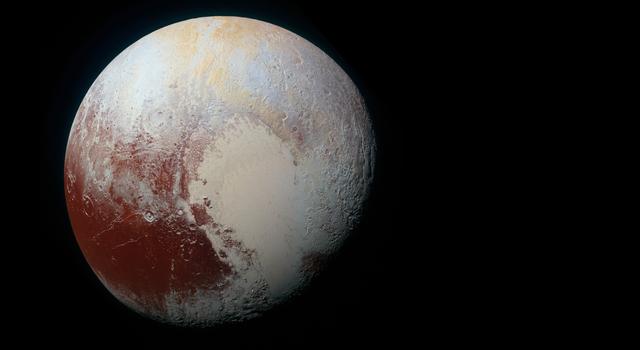
In 2015, after nearly a decade of travel, NASA's New Horizons spacecraft arrived at Pluto for its planned flyby and became the first spacecraft to visit the dwarf planet and its moons. The images and scientific data the spacecraft returned brought into focus a complex and dynamic world, including seas of ice and mountain ranges. And there's still more left to explore. But New Horizons' journey is far from over. After its flyby of Pluto, the spacecraft continued deep into the Kuiper Belt, the band of icy bodies beyond the orbit of Neptune. In 2019, the spacecraft flew by a snowman-shaped object later named Arrokoth. In the 2020s, New Horizons will continue studying distant Kuiper Belt objects to better understand their physical properties and the region they call home. The new information gathered from the Pluto and Arrokoth flybys provides students with real-life examples of the ways in which scientific understanding changes as additional data is collected and gives them a chance to engage with the data themselves. At the same time, New Horizons' long-distance voyage through the Solar System serves as a good launchpad for discussions of solar system size and scale.
Explore More
- Pluto lessons for educators
- Pluto activities for students
- Pluto articles from NASA/JPL Edu
- Learn more about NASA Solar System missions and science
7. The Voyagers' Journey Into Interstellar Space

In 1977, two spacecraft left Earth on a journey to explore the outer planets. In the 2010s, decades after their prime mission ended, Voyager 1 and Voyager 2 made history by becoming the first spacecraft to enter interstellar space – the region beyond the influence of solar wind from our Sun. The Voyager spacecraft are expected to continue operating into the 2020s, until their fuel and power run out. In the meantime, they will continue sending data back to Earth, shaping our understanding of the structure of the solar system and interstellar space. The Voyagers can help engage students as they learn about and model the structure of the solar system and use math to understand the challenges of communicating with spacecraft so far away.
Explore More
- Voyager lessons for educators
- Voyager activities for students
- Voyager articles from NASA/JPL Edu
- Learn more about NASA's Voyager mission
8. The Search for Planets Beyond Our Solar System
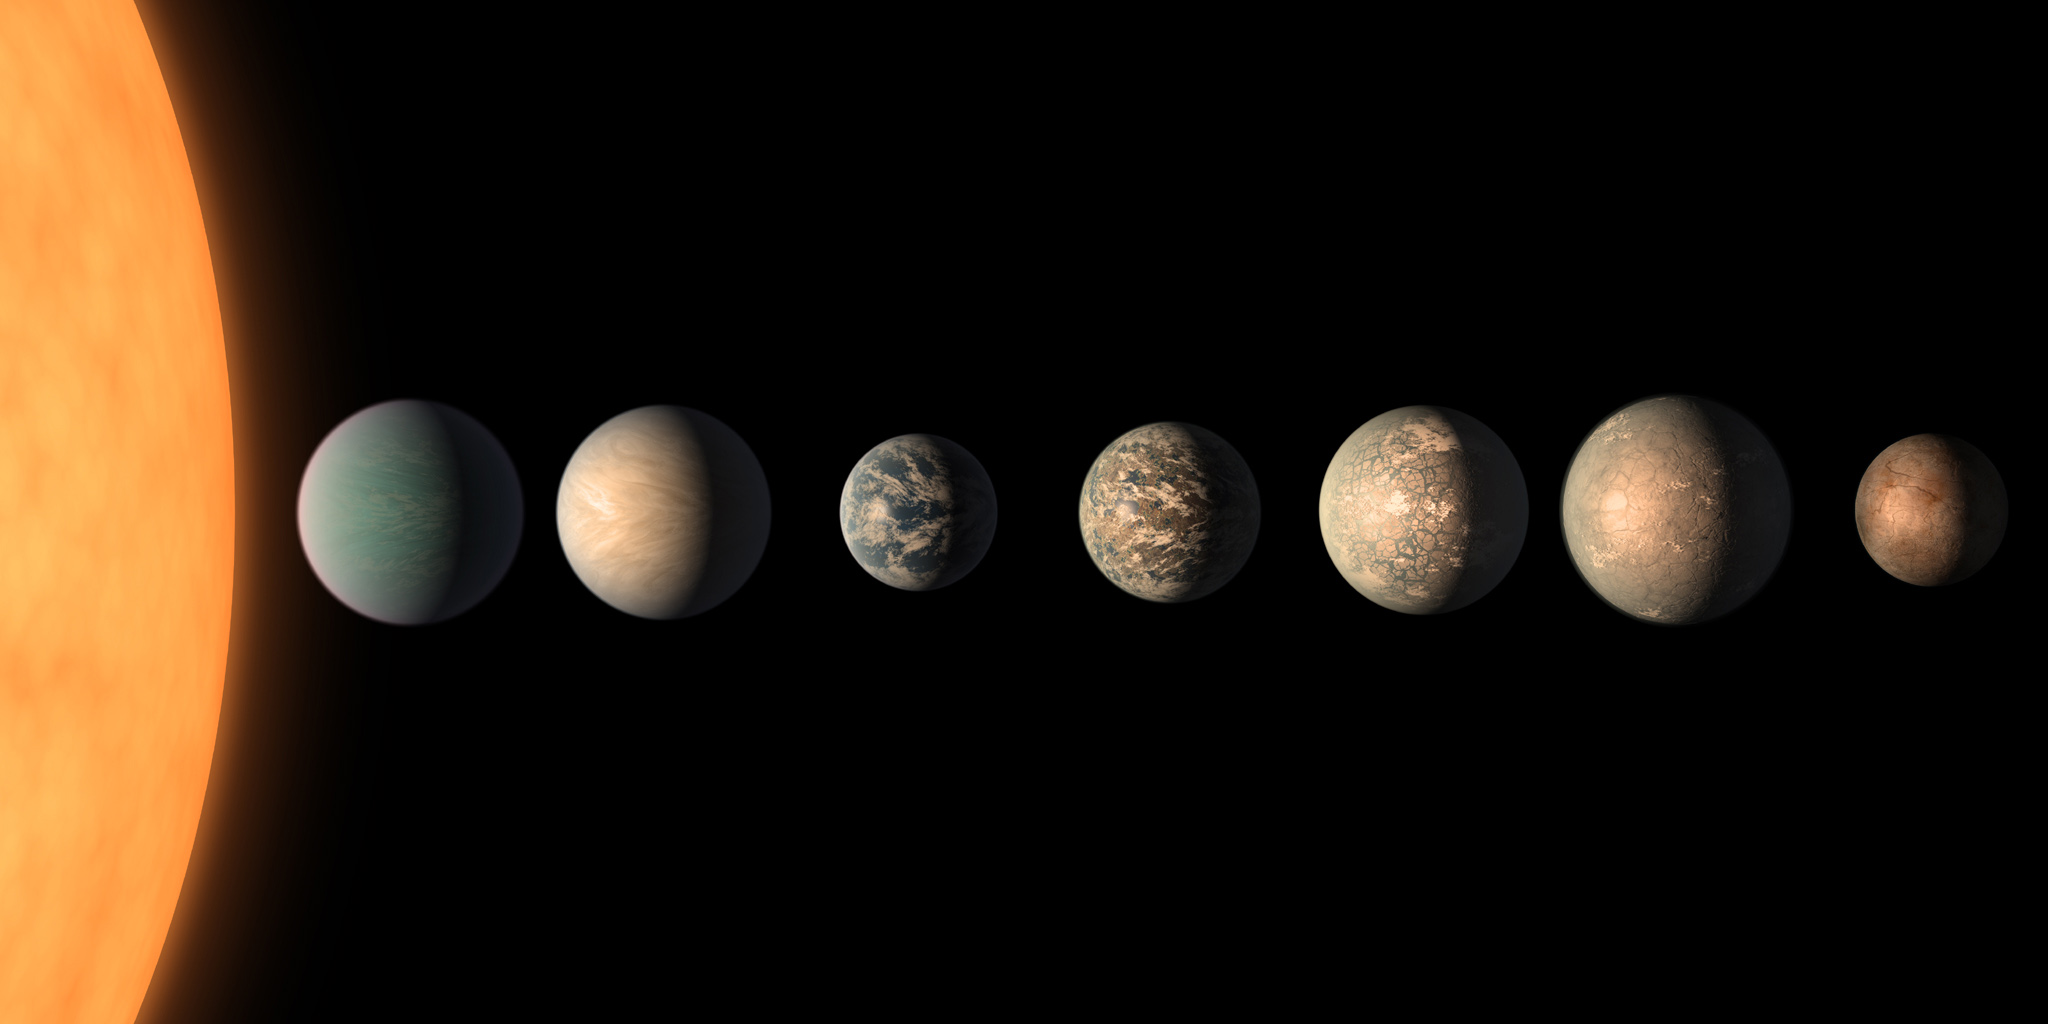
It was only a few decades ago that the first planets outside our solar system, or exoplanets, were discovered. The 2010s saw the number of known exoplanets skyrocket in large part thanks to the Kepler mission. A space telescope designed to seek out Earth-sized planets orbiting in the habitable zone – the region around a star where liquid water could exist – Kepler was used to discover more than 2,600 exoplanets. Discoveries from other observatories and amateur astronomers added to the count, now at more than 4,100. In one of the most momentous exoplanet findings of the decade, the Spitzer telescope discovered that the TRAPPIST-1 system, first thought to have three exoplanets, actually had seven – three of which were in the star’s habitable zone. With thousands of candidates discovered by Kepler waiting to be confirmed as exoplanets and NASA's latest space telescope, the Transiting Exoplanet Survey Satellite, or TESS, surveying the entire sky, the 2020s promise to be a decade filled with exoplanet science. And we may not have to wait long for exciting new discoveries from the James Webb Space Telescope, set to launch in 2021. Exoplanets are a great way to get students exploring concepts in science and mathematics. In the lessons linked to below, students use math to find the size and orbital period of planets, learn how scientists are using spectrometry to determine what makes up exoplanet atmospheres and more.
Explore More
- Exoplanets lessons for educators
- Exoplanets activities for students
- Exoplanets articles from NASA/JPL Edu
- Learn more about NASA exoplanet missions and science
9. Shining a Light on Black Holes
Even from millions and billions of light-years away, black holes made big news in the 2010s. First, a collision of two black holes 1.3 billion light-years away sent gravitational waves across the universe that finally reached Earth in 2015, where the waves were detected by the Laser Interferometer Gravitational-Wave Observatory, or LIGO. This was the first detection of gravitational waves in history and confirmed a prediction Einstein made 100 years earlier in his Theory of General Relativity. Then, in 2019, a team of researchers working on the Event Horizon Telescope project announced they had taken the first image capturing the silhouette of a black hole. To take the historic image of the supermassive black hole (named M87* after its location at the center of the M87 galaxy), the team had to create a virtual telescope as large as Earth itself. In addition to capturing the world's attention, the image gave scientists new information about scientific concepts and measurements they had only been able to theorize about in the past. The innovations that led to these discoveries are changing the way scientists can study black holes and how they interact with the space around them. More revelations are likely in the years ahead as scientists continue to analyze the data from these projects. For students, black holes and gravitational waves provide a basis for developing and modifying scientific models. Since they are a topic of immense interest to students, they can also be used to encourage independent research.
Explore More
- Black hole lessons for educators
- Black hole activities for students
- Black hole articles from NASA/JPL Edu
TAGS: Teachable Moments, K-12 Education, Educators, Students, STEM, Lessons, Activities, Moon, Mars, Ocean Worlds, Small Objects, Pluto, Voyager, Exoplanets, Black Holes, Earth Science, Earth, Climate Change