Blogs | Dawn Journal | May 23, 2014
Vesta 360

The Dawn mission is currently en route to dwarf planet Ceres, its second destination. It spent a productive fourteen months orbiting its first destination, giant asteroid Vesta, in 2011-12, gathering splendid sets of data. The spacecraft may have moved on, but the science team continues to explore that data, enriching our understanding of Vesta’s formation and history.
Getting the “Big Picture”

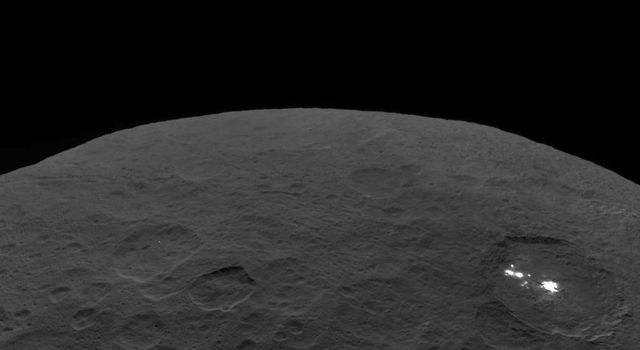
Vesta is a large protoplanet with remarkably variable topography—mountains, troughs, boulders, craters, cliffs, and more. The wealth of high-resolution imaging data from the Dawn mission has given us an amazing view of its surface. However, looking through individual frames or image mosaics can make it difficult to see its surface features in a global context and get the “big picture” of Vesta. On the other hand, the images taken early on as the mission approached the protoplanet show the whole of Vesta, but with low surface resolution. To better visualize Vesta at high resolution, I used the open-source program POV-Ray, combining images and topography data to create striking 3-D graphics.
The program let me take a shape model of Vesta, created from Dawn’s framing camera data by Bob Gaskell at the Planetary Science Institute, and wrap an image around it. For the image, I used a global mosaic developed by our framing camera team partners at the German Aerospace Center (DLR) from high altitude mapping orbit clear-filter images. This mosaic has a resolution of 60 meters (about 200 feet) per pixel. I then used POV-Ray to make ‘snapshots’ of this model of Vesta as it rotated, varying the latitude from +45 to -45 degrees. Those individual frames were combined into the movie shown below.
You will notice how Vesta is sculpted by troughs that cut through the equatorial and northern hemisphere regions (Divalia Fossa and Saturnalia Fossa, respectively). To give you a sense of scale, Divalia Fossa dwarfs the Grand Canyon! Also notable are the ‘Snowman’ craters Marcia, Calpurnia and Minucia, and the giant southern hemisphere impact basin Rheasilvia, with a diameter of over 500 km (310 mi). Its central peak rises almost 25 km (16 mi) from the lowest point of the crater floor, making it one of the tallest mountains in the Solar System. For comparison, Mt. Everest is 8 km, or about 5 mi, above sea level.
Seeing in 3-D
To create a 3-D version, I used the same approach with a key twist. In the same way that your eyes see an object from slightly different angles, thanks to binocular vision, I took two snapshots from slightly different orientations for each movie frame. The left view is rendered in red, and the right view is rendered in blue-green, so when viewed through 3-D glasses Vesta appears as a three-dimensional body floating in your computer screen.
Looking through color filters
The above movies all use clear-filter imaging data, which are rendered in levels of grey. Dawn also took images through 7 different color filters. If a color image is constructed using red, green and blue filters, the surface colors are very subtle and it still looks mostly grey. However, taking ratios of different colors makes small differences in color more intense. We can construct a ‘false-color’ image in which the red, green, and blue values are all ratios of different colors. This highlights subtle differences and makes variations in surface properties more obvious. I made the following movie using what the Dawn team refers to as the Clementine color ratios, after a similar technique used for the Clementine mission to the Moon.
Now let’s look at the science behind the colors. In this movie, bluer colors mean that, in the visible part of the spectrum, the surface reflects more blue light (shorter wavelength) than red light (longer wavelength). Redder colors mean the opposite, that the surface reflects more red light than blue light. The actual difference in the amount of reflected red or blue light is often quite small, but by using the Clementine color ratios, these small differences are made more obvious. In addition to the red-blue trend, the presence of a green tint indicates that a region of the surface is a stronger absorber of light with a wavelength around 950 nm than other parts of the surface. Absorption of light at this wavelength is generally due to the presence of ferrous iron (Fe 2+).
However, it is not always clear from the colors alone what is causing the variations in the strength of absorption. The abundance of certain minerals, particle size, the presence of opaque materials, and other factors may all contribute. Similarly, the orange-colored spots are distinctive and are often associated with impact craters, although their origin and composition is still somewhat uncertain.