Your planet is changing. We're on it.
Earth Right Now | August 7, 2017
The next big question in sea level science
Projecting regional changes
“Sea level scientists have a pretty good grasp on global mean sea level,” said Steve Nerem, a professor in the Aerospace Engineering Sciences Department at the University of Colorado and the team leader for NASA’s Sea Level Change Team (N-SLCT). “It’s the regional sea level change that’s the next big question, the next big step for sea level science,” he added.
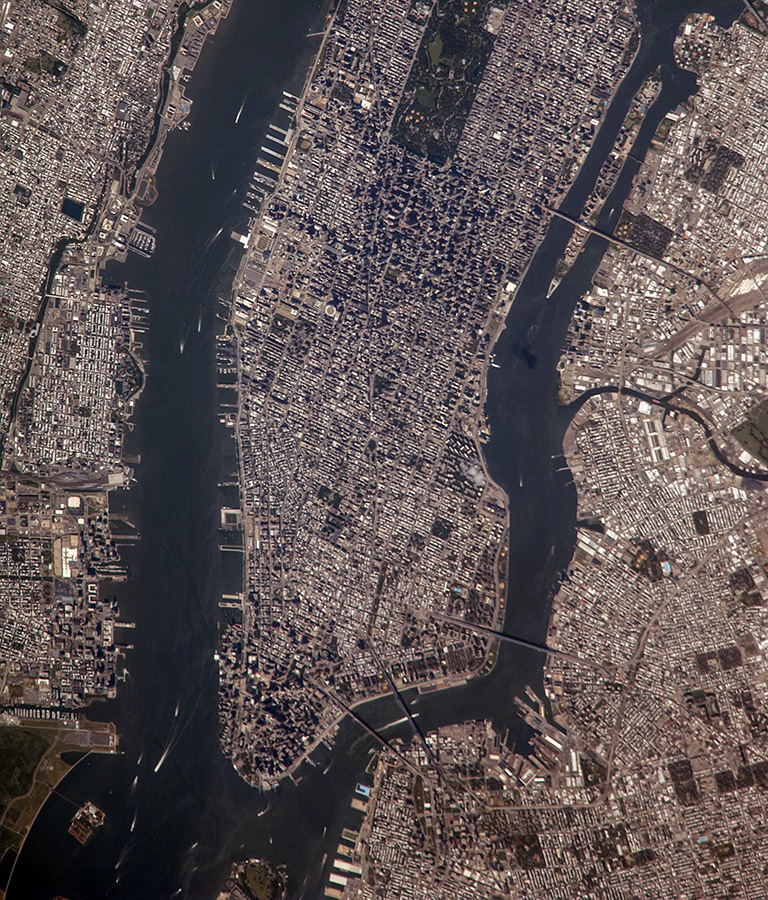
Nerem and much of the rest of the N-SLCT were in New York City this July where more than 300 scientists from 42 countries gathered at Columbia University for a weeklong Regional Sea Level Changes and Coastal Impacts Conference. The international conference was organized by the World Climate Research Programme (WCRP), Climate and Ocean – Variability, Predictability, and Change (CLIVAR), and the UNESCO Intergovernmental Oceanographic Commission and was co-sponsored by NASA.
Regional sea level change is more variable, over both space and time, than global sea level change and can diverge by up to 7 inches (20 centimeters) or more from the global mean. Additionally, making regional projections about future sea level differs from making global mean sea level projections. This is due to the fact that different processes contribute to sea level change in coastal regions.
Global sea level rise is caused by thermal expansion of warmer water plus contributions from ice sheets and glaciers. Regional sea level change, especially along coastlines, is influenced by additional factors, including vertical land movements, waves and tides, and winds and storms. So in order to estimate sea level inundation and flood risk, scientists have to understand all the factors that contribute to extreme water levels such as local sea level rise, land subsidence, tides, waves and storm surge.
Members of the N-SLCT understand the importance of studying coastal sea level change and improving the accuracy of regional projections. Ben Hamlington, assistant professor in the Ocean, Earth and Atmospheric Sciences Department at Old Dominion University in Norfolk, Virginia, and upcoming team leader for N-SLCT is serious about understanding sea level.
“The overarching theme of my scientific research,” he said, is “to consistently improve regional sea level projections.” Manhattan, where the conference was held, for example, lies within a few feet of sea level, and furthermore, the U.S. East Coast has some of the highest amounts of projected sea level increase.
“Global means aren’t very useful for someone who’s on the coast of Virginia where I live,” Hamlington said. A main part of the challenge of predicting regional sea level is that what causes the sea level changes and the flooding varies dramatically from place to place. Hamlington described a term called “nuisance flooding,” which is a type of persistent tidal flooding that leads to public inconveniences like road closures and backed-up storm water systems.
“Basically it means your path to work has to change because a certain road is blocked or impassable. You can still get to work, but it might take longer,” he explained. Right now, these nuisance-flooding events occur multiple times a year. But as sea level continues to rise, the nuisance flooding will get more and more frequent and will become even more of a problem. “Where I live, it’s hard to separate the pure science from the applications. With all this flooding, the broader significance of your work is very clear,” he said.
In Norfolk, Virginia, glacial isostatic adjustment (GIA) is around 0.04 inches (1 millimeter) per year, another millimeter per year of subsidence is due to slow subsidence into the Chesapeake Bay Meteor Impact Crater plus ground water pumping. Finally add 0.08 inches (2 millimeters) per year from the ocean rising and “You get the long-term tide gauge rate of relative sea level rise of just lower than 0.20 inches (5 millimeters) per year over the last 100 years. That’s a pretty high rate of sea level rise over a long period of time,” Hamlington explained. “Beyond nuisance flooding, there are also extreme events,” he continued. “During a storm event, you can get several feet of water in some parts of Norfolk.”
Actionable science
Stakeholders and decision makers are the ones driving the demand for improved regional sea level projections, Hamlington continued. “They’re the ones driving the discussion toward regional projections and that’s what’s needed for planning efforts.” These stakeholders include state and local public works officers responsible for infrastructure such as stadiums, roads, seawalls, and dykes plus pumps, water utilities, other utilities, businesses, and coastal inhabitants.
Scientists are responsible for helping society. This is why decision makers and scientists have come together to co-produce actionable science, to discuss how to communicate and collaborate, and to ensure that sea level science is being understood by the adaptation community.
“This is one of the biggest sea level conferences that we’ve had, when everybody who is working in different areas of the field comes together,” said Nerem. There were presentations on a variety of techniques to measure sea level change: tide gauges, measurements in marshes, paleo-sea level, corals, but from the perspective of the N-SLCT, “ We’re really focused on how to use remote sensing, satellite altimetry from Jason-1, 2 and 3 and Gravity Recovery and Climate Experiment (GRACE) combined with GPS measurements to improve regional sea level measurements and projections.”
Nerem’s project targets regions around the globe that are susceptible to inundation but don’t have much measurement infrastructure, such as Bangladesh. Many of these regions do not have detailed digital elevation models or 50 years of tide gauge measurements like we do in the United States. “If we use our satellite techniques and test them in a place we understand, then we can go out where we don’t have that infrastructure and assess future sea level change in those regions.”
The N-SLCT hopes to leverage the satellite observations as much as possible to try to better understand future regional sea level change. This will help decision makers, coastal managers and stakeholders better adapt and prepare for the impacts of sea level rise.
According to Nerem, “We would like to produce a new assessment of future regional sea level change that benefits from the extensive record of satellite measurements collected by NASA.”
Thank you for reading,
Laura
TAGS: SEA LEVEL, REGIONAL SEA LEVEL, GLOBAL SEA LEVEL
Earth Right Now | June 5, 2017
Sun and sky, snow and ice
Reflections at the top of the world
It was 11:30 in the morning and GLISTIN-A instrument engineer Ron Muellerschoen and I were in northern Greenland at the Thule Air Base pier looking over the frozen Wolstenholme Bay. We’d been talking about the time Ron was wearing shorts here during the summer, but today it was the typical -22 Fahrenheit (-30 Celsius.) And even though over the past week we’d somehow gotten used to the cold and I was wearing a big parka, my legs were starting to get cold after walking for an hour. So we decided to head back.
As we turned around to go, I was struck in the face by the sun’s rays reflecting off the ice-covered ground. The brightness was astounding. And in that instant the meaning of “albedo” was seared into my brain in a way that went beyond reading about the science or looking at illustrations and animations.
There was something special about the experience of having the rays of the sun, which was sitting low in the high latitude sky, hit the ice surface at that extremely low angle and reflect off into my eyes.
Albedo is a measure of how reflective a surface is, how much light energy bounces off and reflects away and how much light energy gets absorbed. (Think hot asphalt on a sunny day. Black asphalt has a low albedo and absorbs light energy, while the brightest white has the highest albedo and reflects the light.)
I stood for a moment, looking at the ground — a hard, dry, crusty mixture of ice and snow that made an exceptionally satisfying crunch crunch noise as our boots marched through it — and tried to figure out the color: 50 shades of white. I settled on white/light blue/silvery sparkle. Due to the low angle of the sun, the tiniest rough edge the size and shape of a pebble on the ground’s textured surface left a long, dark shadow.
No matter where we were or how we stood or what time of day, all day, every day, there were always long shadows — crazy long shadows. At 78 degrees north latitude, a full 12 degrees above the Arctic Circle, the sun will never be overhead. Never. I know that seems unbelievable, but even during the summer solstice, when Earth’s North Pole is tilted toward the sun, or during the four summer months of 24-hour daylight, the sun is always low, low, low at this latitude.
Low on the horizon
In that moment, I also understood another science question that had been bothering me. I’d been wondering why the meter-thick sea ice hadn’t yet begun to melt. Even though it was the end of March, even though the equinox had passed, the sun was out and the days were getting longer. In fact, up here the days were getting much longer, very quickly. On March 23, just three days after the equinox, we were already having 14-hour days with sunsets lasting past 9 p.m. That’s because in these high latitudes, the day length can increase by as much as 40 minutes per day. And by mid-April, just a few weeks after spring equinox, there will be 24 hours of daylight and the sun won’t set again until September.
By mid-April the meter-thick layer of frozen seawater that covers the sea surface and fills the fjords will completely melt and expose the dark blue ocean underneath. But today, even in this brilliant sunshine, even on this day of 14-hour sunlight, the ocean was still completely frozen over.
But “Why?” I’d been wondering. Why, with all this extra sunshine, was the sea surface still so frozen? And why did that hard, dry, crusty mixture of ice and snow still remain on the ground?
In that instant, as the glint of the sunlight reflecting off the icy ground hit my face, I knew exactly why. It was the extraordinarily low angle of the sunlight that bounced right off the stunning bright whiteness of the ice. The sunlight was not absorbed by the ice and snow and instead was reflected away. It wouldn’t be until another month or so that the sun would get a little higher in the sky. And although the sun would never be directly overhead up here, it would be high enough to begin melting the ice.
No matter how much a person studies Greenland, or the northern latitudes, or albedo, or Earth in general, going into the field to experience those things can change your entire understanding of the world and how it works. I stood there for a moment, just allowing the high-latitude sun’s cold rays to glance off the snowy ice and shine straight into my face.
NASA’s Oceans Melting Greenland (OMG) team is here in Greenland; here to find out specifically how much ice the island is losing due to warmer ocean waters around the coastline. There is almost no ocean data in remote places like this, but OMG is busy working to change that, studying the complex ocean processes that affect Greenland's coastline because gathering data is critical to understanding Earth’s complex climate. This information will help us understand the amount of sea level rise we're going to have around the world.
Thank you for reading,
Laura
TAGS: EARTH, OCEANS, MELTING, GREENLAND
Earth Right Now | May 15, 2017
Are you ready to work?
Dive into a sea of Oceans Melting Greenland data
"Get to work." The phrase stuck in my head.
I had just walked out of a two-and-a-half-hour debriefing with NASA’s Oceans Melting Greenland (OMG) Principal Investigator Josh Willis, but the whole meeting could be summed up in those three little words of his: Get to work.
It was as though he’d been ringing one of those big ol’ dinner gongs. Data! Hot off the press! Come and get your data! Calling all oceanographers, geologists, paleo-climate scientists: come and get a big ol’ helping of free data.
He made me hungry for data, too.
OMG has just returned from its second spring season. Every April for five years, just before the ice starts to melt, OMG flies a radar instrument over almost every glacier in Greenland that reaches the ocean and collects elevation measurements within a 6.2-mile (10-kilometer)-wide swath for each glacier individually so we can measure how quickly each one is thinning. That’s literally hundreds of glaciers.
“We have more than 70 of these swaths that cover a couple hundred glaciers to create new elevation maps that are high accuracy, high resolution and high quality,” Willis said.
OMG also has bathymetry data from sonar and gravimetry. And we have a year’s worth of Airborne Expendable Conductivity Temperature Depth Probes AXCTD data collected last September plus hundreds of vertical profiles of temperature and salinity taken from ship surveys. “We have temperature measurements in many glacial fjords that have never had a historical temperature profile before. And none of that data is being used to its fullest extent yet.” OMG will set the baseline so we know what the water temperatures are today, and as we look to the future, we can watch them warm. That’s huge.
I recounted all the times I’ve told someone that many parts of the ocean are still so unknown. I thought about all the times I’ve written about the OMG aircraft flying into remote, uncontrolled airspace, or researching the ocean water-ice interface around Greenland: So many of these places still nameless, still anonymous, still unidentified, still unknown. It’s mind blowing.
And somewhere in all this new data is information about the correlation between the ocean water and the ice as well as the answer to the question of how each glacier may or may not be affected by the waters offshore. “We know that warm water reaches a lot of glaciers. And there have been surveys in few places, but we’ve never had a comprehensive survey of the shelf water before,” Willis said.
OMG is mapping out the edges of glaciers and watching them change year on year on year. The mission measures glacial elevation in the last few kilometers before the glacier hits the water to see exactly how much the glacier shrank or retreated or both. In a few cases, the opposite might happen. Over a single year, a glacier might not have had as much calving or it might have slowed down, which would cause it to thicken and advance.
There are literally hundreds of glaciers to research and dozens of papers buried in that data. And anybody who wants to can sift through it and publish. “You could get a Ph.D. done really fast,” Willis added enticingly. Here are some recommendations for interesting scientific research:
- OMG’s temperature data could be used to write oceanography papers about where the warm water is on the shelf and to map out and catalogue which glaciers terminate in deep Atlantic water and which ones sit in shallow water. OMG has enough data to catalogue the depth of the faces of two-thirds of the glaciers around Greenland.
- Paleo-climatologists and geologists can use new clearly mapped-out OMG bathymetry data to study how ancient glaciers carved troughs in the sea floor. Looking at maps of the seafloor will help us understand the implications for Greenland’s ancient ice sheet. Some flat-bottomed troughs, for example, show evidence of where little ancient rivers must have carved their way through to erode the paleo-glaciers. And sea floor sediments could be analyzed to find out how far the ancient glaciers advanced.
- Overview papers that compare and contrast the east, west, north and south coasts of Greenland would be incredibly useful to have.
- Some elevation maps made from historical datasets as well as a few decades’ worth of temperature measurements already exist for some isolated regions across Greenland. Using these historical maps, it’s now possible to compare them with current measurements of temperature and elevation in these locations to observe the changes.
- OMG is also gathering oceanography data around Greenland. Since the Atlantic Ocean water is very warm and salty and the Arctic Ocean water is cold and fresh, the ratio of those two could be analyzed. Warm Atlantic Ocean water has been in the coastal area around Greenland forever, but how much Atlantic water makes it onto the shelf and reaches the glaciers? This is affected by the bathymetry and the winds, which affect the local currents. And according to Willis, “There’s really still a lot to learn.”
Already there are four downloadable datasets right here! So, come and get it, all you hungry Ph.D. oceanographers.
Get to work.
I can't wait to read your papers,
Laura
TAGS: EARTH, OCEANS, MELTING, GREENLAND
Earth Right Now | April 19, 2017
A vast, melting desert
NASA flies northward to monitor Greenland’s glaciers
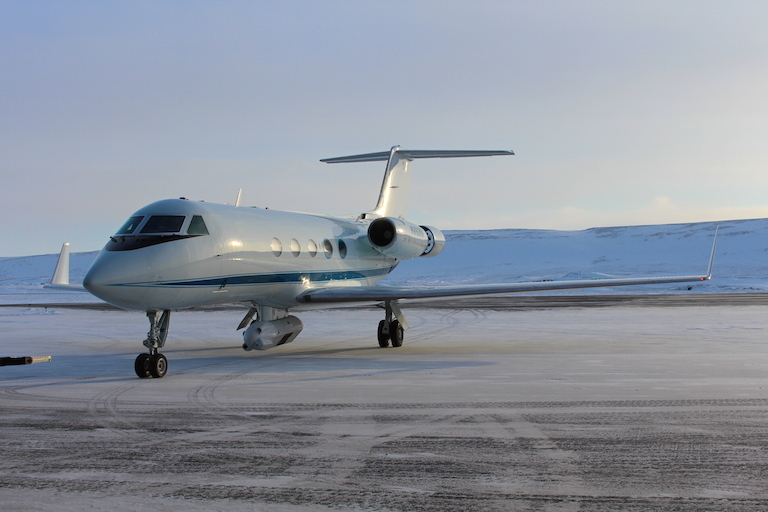
I looked out the window of NASA’s modified G-III aircraft across the expanse. I knew what I would see. I knew it would look like white pillow-y ripples going on and on and on, way farther than anyone could see, like a vast field of white sand dunes stretching away into the distance.
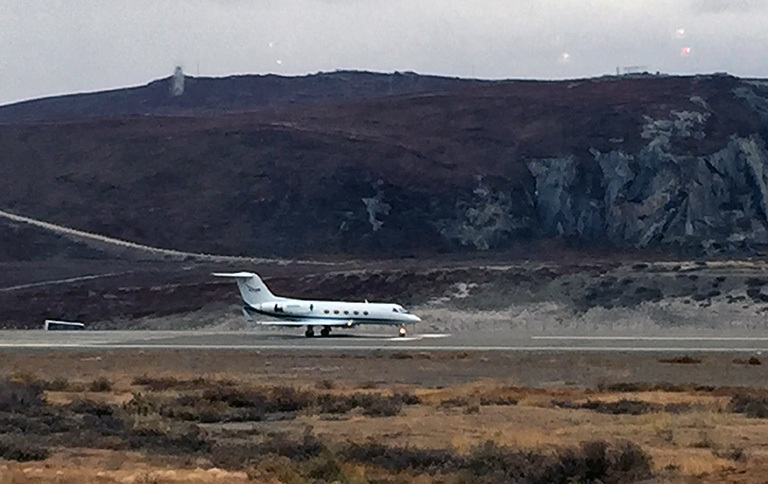
The Oceans Melting Greenland (OMG) aircraft was flying across the entire top half of Greenland from the northwest coast to the northeast coast to make the day’s first science measurements. And the first science flight line was all the way across the Greenland Ice Sheet, across 620 miles (1,000 kilometers) of ice that’s up to 2 miles thick and hundreds of thousands of years old. And although I’d flown in Greenland a bunch of times before, I’d only ever flown over the coastal areas, where glaciers around the ice sheet’s edges carve their way through the Greenland terrain, to cut out deep, narrow fjords over centuries’ time.
Everything here is vast and expansive: the size, the views, the enormous quantity of ice.
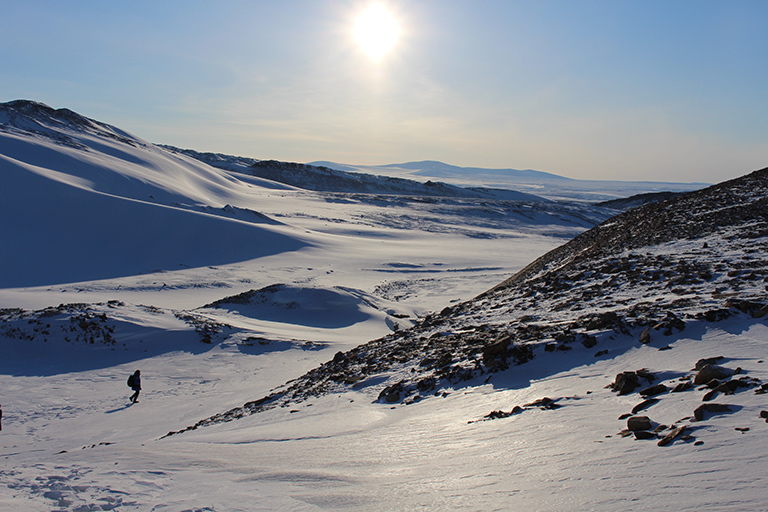
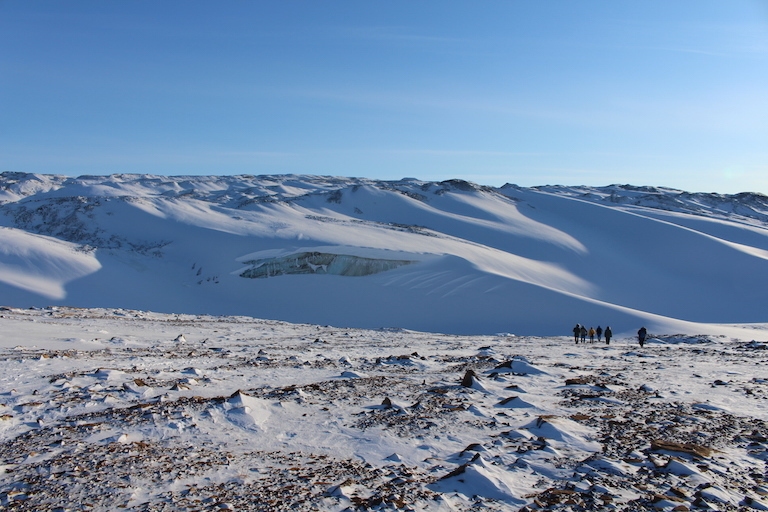
Two days before, I’d trekked up to the ice sheet with a few members of the OMG team. We stood in the insanely cold, dry, biting air (Greenland is one of the least humid areas on planet Earth, with the cleanest, clearest air) and gazed into the incomprehensible distance. It was easy to use a snow boot to scrape the 2 inches or so of fine, dry, powdery snow away from the ice sheet to uncover the hard, greenish blue ice.
On the edge of the ice sheet, a slice of ancient ice layers was exposed like a glistening wall, and we’d walked past it on the way up to the top of the sheet. The ice wall was so vertical and so sheer, the snow that hid the other parts of the edge had fallen away, and we could see its smooth surface shining like a gem: striped blue and green. That ice is hundreds of thousands of years old, made from snow that fell year after year after year, eventually becoming compressed and preserved in this cold, dry desert environment.
Standing on top of the ice sheet, I imagined it under my feet, going down and down and down for a mile or more.
A mile—or more—of ice.
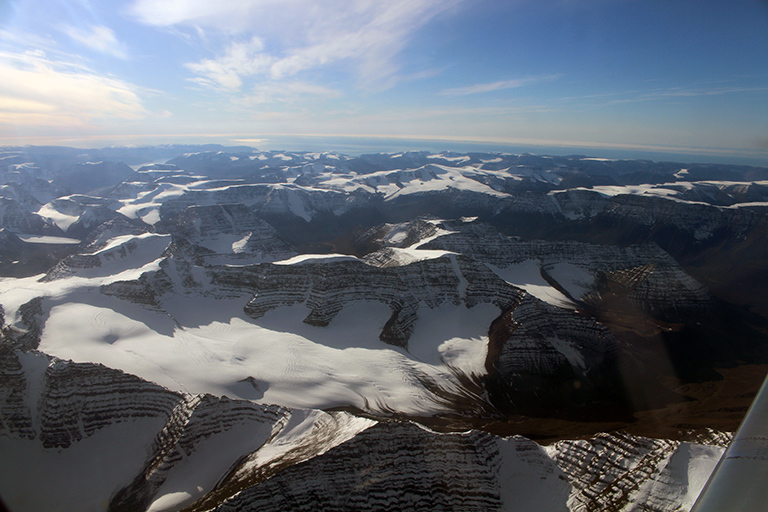
Everything here is vast and expansive: the size, the views, the enormous quantity of ice. Flying over them, the glaciers look like hundreds of broad frozen rivers, each one up to a few miles across, each one channeling its way from the interior of the landmass toward the sea over thousands of years. Each glacier carved out a fjord through the rock and out to sea in the same way a river erodes its channel, except it’s so much bigger, so much slower and the erosional power of the ice is so much more intense. From up here, the glacier’s impossibly slow creep seems frozen in both space and time. But the glaciers are moving. Stress fractures or crevasses, which are easy-to-observe evidence of glacier movement, form as the glaciers slope downhill toward the sea. And of course, we also have scientific measurements. Detailed satellite images show that the terminal edges of many glaciers such as Jakobshavn have receded by as much as 0.4 miles (600 meters) per year in recent times. Scientists also have time-lapse footage of seaward glacier flow.
But having evidence of glacier flow, and even glacier recession, is only part of the story. As a warmer atmosphere and a warmer ocean around the coastline continue to melt the massive amount of ice that covers Greenland, the ice ends up flowing into the ocean, which causes sea level rise worldwide.
As we flew over, the GLISTIN-A instrument received data from a 12-kilometer swath of whatever is below and off to the sides of it, in this case glaciers. Using these data, we can measure, with great precision, the height of each glacier we fly over. See, when the end of an individual glacier melts and calves into the ocean, the whole glacier speeds up and flows even faster downhill toward the ocean because there’s less friction against the sides and bottom to slow it down. The faster it moves, the more it stretches — like pulled taffy — and when a glacier is all stretched out, its elevation is lower. And because OMG will fly the same science lines along the same coastal glaciers every year for five years in a row, we’ll be able to find out how much elevation each glacier has lost, how fast it’s flowing into the ocean and how much ice has been lost.
They sure appear stable, still, enduring. But they’re not. They’re melting.
They sure appear stable, still, enduring. But they’re not. They’re melting.
And northern Greenland, along with the rest of the higher latitudes in the Northern Hemisphere, is experiencing some of the most intense impacts of global climate change right now, today.
OMG.
Thank you for reading.
Laura
TAGS: EARTH, GREENLAND, GLACIERS
Earth Right Now | February 1, 2017
Glaciers on the edge
“This year we’re gonna bring it!”
Oceans Melting Greenland (OMG) Principal Investigator Josh Willis told me excitedly. “It’s the beginning of year two of this five-year airborne mission, which means that by comparing data from the first and second years, we’ll be able to observe changes in Greenland’s glaciers and coastal ocean water for the first time.” Glaciers around Greenland’s jagged coastline have been melting into the ocean and causing increased sea level rise, so measuring the amount of ice mass loss will help us understand the impact of these changes, Willis said. “Will we see 5 feet of sea level rise this century … or more?”
See, Earth’s ocean, more than the atmosphere, is responsible for creating a stable climate. And as global warming has increased the temperature of the ocean waters surrounding Greenland, that warmer ocean water is melting the ice sheet from around its edges. “Hey! The ocean is eating away at the ice sheet!” Willis often cries when explaining the mission. And Team OMG is measuring how much of that warm water could be increasing due to climate change.
Decoding the environment
I understand how Willis and Project Manager Steve Dinardo get excited about measuring sea level rise. Greenland’s ice melt is accelerating, which explains why NASA is paying attention to it. Plus, after a successful first year, the team is fully aware of the stark beauty of Greenland’s rugged landscape and seascape and the rewards of bonding as a team. Dinardo told me he was “ecstatic about the incredible progress Team OMG has made in the last twenty-two months.”
As scientists, decoding the natural world is our way of caring about the environment. We care about Greenland’s icy coastline, so we go there. We go there and observe. We go there and measure. For there is something undeniable about the sheer beauty of this planet, and any time you get to experience it is a moment to feel exuberant and alive. Plus, flying around with a great team in a modified NASA G-III aircraft ain’t too shabby either.After a successful first year, the team is fully aware of the stark beauty of Greenland’s rugged landscape and seascape and the rewards of bonding as a team.
But wait. Before I continue, there’s something you probably noticed: Willis said he named this Greenland observing expedition Oceans Melting Greenland, or OMG for short, because, hey, OMG is the exact response you might have when you find out what’s going on up there.
Parts of Greenland’s coastline are so remote, so difficult to access by boat, that they’d remain uncharted, especially under areas that are seasonally covered with ice. Imagine the edge of an unimaginably complicated winding coastline, that unknown place where ice meets water meets seafloor. Big chunks of remnant sea ice clog up the water, and the glacier has retreated so recently that the coastline is changing as fast as, or even faster than, we can study it.
The seawater around 400 meters deep is 3 to 4 degrees Celsius warmer than the water floating near the sea surface. And the sea floor bathymetry influences how much of that warm subsurface layer can reach far up into the fjords and melt the glaciers. So, to learn about the interface between where the bottom of the ice sheet reaches out over the seawater and down into the ocean, OMG began by mapping undersea canyons on the M/V Cape Race, a ship equipped with an echo sounder, which sailed right up the narrow fjords on the continental shelf surrounding Greenland to the places where the warmer Atlantic Ocean water meets the bottoms of the frozen, 0-degree glaciers. The crew had to snake in between floating icebergs and weave in and out of narrow fjords. The Cape Race used a multibeam echo sounder to map undersea canyons, where the warm seawater comes in contact with and melts the glaciers.
The next four years
In the spring of 2016, the Oceans Melting Greenland (OMG) team began surveying glacier elevation near the end of marine-terminating glaciers by precisely measuring the edges of the ice sheet on a glacier-by-glacier basis, using the Airborne Glacier and Land Ice Surface Topography Interferometer (GLISTIN-A), a radar instrument attached to the bottom of a modified NASA G-III aircraft. Data collected this spring and over the next four years can be compared with data collected in the spring of 2016 so we can determine how fast the glaciers are melting.
The investigation continued into last fall, with the team dropping more than 200 Aircraft eXpendable Conductivity Temperature Depth (AXCTD) probes that measured ocean temperature and salinity around Greenland, from the sea surface to the sea floor, through a hole in the bottom of the plane. “In most of these places,” Willis told me, “there’s been no temperature and salinity data collected. Ever.”As scientists, decoding the natural world is our way of caring about the environment.
The team will drop more ocean probes across the same locations to find out “how much ice melts when the water is this warm,” what the melt rate is, and how much that rate is increasing, because no one knows the melt rate yet.
No one.
Big picture project
“OMG is a big picture project,” Willis explained. ”We want to see what’s happening in the ocean on the large scale and what’s happening to the ice sheet on the largest scales.”
As part of Team OMG, I also flew on NASA’s G-III into uncontrolled airspace to places where no other aircraft had flown before, into narrow and steep ice-covered fjords, winding in and out, up and down, over and through to observe and measure, like scientists do. I saw the brilliant white ice carve its way through steep brown valleys into open ocean water. I saw the glorious expanse of white upon deep blue going on and on and on below us as we flew just 5,000 feet above the winding coastline. It was extraordinary.
And if you just thought “OMG,” Willis would be proud.
Thanks for reading.
Laura
Earth Right Now | November 22, 2016
This Thanksgiving, let's be thankful for planet Earth
Sigh. Sometimes life feels heavy.
Even as the holidays approach and we’re all supposed to be in a holiday spirit, supposed to be joyous. Sometimes we’re just not there.
But, as always, NASA gives me the opportunity to look at Earth from the highest perspective. From above, the world appears remote and untouched. There’s nothing but the timeless, immaculate and infinite beauty of our planet.
Sigh.
Together, you and I get to take this opportunity to share thankfulness for our Earth and everything pristine and beautiful about it.
Thank you for reading. I really mean it.
Laura
Earth Right Now | November 8, 2016
Need a dose of calm?
Slow down and relax. Earth is beautiful.
Earth, from the vantage point of space: Serene, breathtaking, magnificent. No matter how crazy busy your day is, no matter the level of stress, or chaos, or distraction, take a moment today—right now, in fact—to step back and feast on the great wonder of our home planet, Earth.
I like to think about being in nature when I get caught up in the overwhelming day-to-day news cycles. For me, getting out in nature always calms my nerves. It gets me centered and grounded; it reminds me that I have the strength to face life’s challenges.
Namaste,
Laura
Earth Right Now | October 17, 2016
Making lemonade out of climate change
Science unveils the sheer beauty of Planet Earth
You might expect that being a science writer primarily focused on climate change and climate science could put me in a bad mood. You can see this if you read the comments on many of my blogs, on our NASA Climate Change Facebook page and on my TEDx video. Many commenters think I should express more alarm about our changing climate.
Yes, climate change is happening, it’s real and it’s serious. I know it and my climate scientist friends know it. But I’m just not the kind of person who can spend my days in fear, despair and anger. I just can’t. Fundamentally, it’s not who I am.
What works in my life is finding something positive and then taking action in that positive direction, which explains how I found myself traveling to Kangerlussuaq, Greenland, to support NASA’s Oceans Melting Greenland team in the field. See, NASA is the exploration leader — on this planet and beyond. And believe me, Greenland is out there. It’s so remote, so unknown, so unpopulated, that even after thousands of years of human exploration of our planet and hundreds of years of scientific exploration we still know very little about the ocean surrounding Greenland’s coastline and the water inside its long, ice-carved fjords. Greenland is unusual, a unique environment unto itself. The ice sheet is so vast, it makes its own weather patterns.
So, of course, with NASA’s prominent role in Earth remote sensing and climate change and our capacity to explore the unknown, we’d be the first ones to fly right up into those exceptionally remote fjords to measure the ocean water there. As scientists, decoding the natural world is our way of taking meaningful positive action. It’s our way of caring. We care about the warm water that reaches up Greenland’s icy coastline and melts the ice sheet into the water. We care, so we go there and witness. We go there and we observe. We go there and we measure. And all the while, we feel like we’ve made an effort, we’ve done good work.
And so I flew with Team OMG on a modified NASA G-III aircraft into uncontrolled airspace to places where no other aircraft had flown before, up into those narrow and steep ice-covered fjords, winding in and out, up and down, over and through to observe and measure, like scientists do.
As I was working, I also got to see the brilliant white ice carve its way through steep brown valleys into open ocean water. I saw the glorious expanse of white upon deep blue going on and on and on below us as we flew just 5,000 feet above the winding coastline. It was extraordinary. And this might seem odd to you, but I felt joyous. Yes, I did. Joyous.
For there is something undeniable about the sheer beauty of this planet, and any time you get to experience it is a moment to feel exuberant and alive.
Check out this video of Team OMG celebrating its accomplishments.
Thanks for reading this blog.
Laura
TAGS: EARTH, CLIMATE CHANGE
Earth Right Now | October 6, 2016
Swoosh
Swoosh! It’s not a sound so much as a feeling.
You feel it in your ears and through your whole body. And everyone on the plane — two NASA G-III pilots, two flight engineers and the rest of the Oceans Melting Greenland (OMG) crew—feels it at exactly the same time. It has become our inside joke.
The swoosh happens every time the flight engineers drop an Aircraft eXpendable Conductivity Temperature Depth (AXCTD) probe through a hole in the bottom of the plane. The AXCTD comes in a 3-foot-long gray metal tube—with a parachute. After it hits the water, the probe measures ocean temperature and salinity from the sea surface down to about 1,000 meters. The tiny difference between cabin and outside pressure pushes the probe out and makes ears pop at the same time.
This is the second week of our three- to four-week mission that will be repeated every September/October for the next five years. We’re finally starting to iron out all the minor details in our protocol. With so many moving parts, the protocol is important, and the intricate timing helps us make sure no one forgets any details and we get the most accurate record of when and where we drop each one.
- 1. Project Manager Steve Dinardo announces “Data recorder ready.”
- 2. Pilots Bill Ehrenstrom and Scott Reagan call out the cloud and ice conditions and the number of minutes to the drop site. Then they determine the altitude for the approach.
- 3. Flight Engineers Terry Lee and Phil Vaughn announce “Tube positioned and ready.”
- 4. At 50 seconds from the drop site, the plane slows down and cruises at about 5,000 feet.
- 5. At 20 seconds, Lee and Vaughn open the cap of the tube—you know, the one with that hole through the bottom of the plane—and everyone’s ears pop (the first time). Protocol states that they announce “Tube open!” but since our ears just popped, we often hear “Well, of course the tube’s open” or “As you already know—tube’s open.”
- 6. At 10 seconds, the pilots count down to 1 and say “drop.” The engineers reply “Sonde’s away” and we all feel that swoosh. There it is. Our ears pop for the second time as the AXCTD is “swooshed” down the tube and out through the hole in the bottom of the plane. (And yes, we all still look at each other with our sly smiles because it’s so much fun to say, “hole in the bottom of the plane.”)
- 7. It is the swoosh, more than anything said during the lengthy protocol script playing through my headset, that tells me—OMG lead scientist Josh Willis—to mark the drop on my GARMIN, a GPS we use to record the location of each drop.
- 8. After each drop, our aircraft banks steeply and we all silently celebrate the fact that we don’t get motion sickness. We continue circling during the six or so minutes it takes for the science probe to parachute down 5,000 feet to the sea surface and make its way through the water column, sending back data to us in real-time on the plane.
During our many, often challenging hours on the plane together, we share these little inside jokes and laugh—not caring if anyone in the outside world thinks it’s funny. Seems like we are bonding. I couldn’t be happier.
TAGS: FLIGHT ENGINEERS, AIRCRAFT, OCEANS MELTING GREENLAND, G-III PILOTS
Earth Right Now | October 6, 2016
A wall of ice in transition
I went off for a day to visit Russell Glacier, which flows from the Greenland Ice Sheet down the Akuliarusiarsuup Kuua River, into the Kangerlussuaq Fjord and out into the Davis Strait. I knew I'd watch it melt right in front of me. And I expected to feel sad standing there so close to such an obvious and intense signal of global warming and climate change.
I stood there as the Arctic sun moved onto the horizon behind me, breathing the cool air, listening to the loud rush of meltwater passing between me and the 200-foot wall of ice in front of me. I thought about the 100,000-year span of time that this ice sheet has lasted on this planet. I looked toward the Akuliarusiarsuup Kuua River valley thinking about the future of that meltwater as it flowed out to sea. As we continue adding heat-trapping gases to our environment, our climate will keep changing and this meltwater will only increase. Someday the whole ice sheet may be gone.
I was supposed to feel sad. But I didn't. Instead I just felt grateful to be alive, right here, right now, in 2016. To be alive in that time between 100,000 years ago and the whatever-will-happen-in-our-climate-changed future.
I hope you understand.
Laura
TAGS: WALL ICE TRANSITION

